Upgrade & Secure Your Future with DevOps, SRE, DevSecOps, MLOps!
We spend hours scrolling social media and waste money on things we forget, but won’t spend 30 minutes a day earning certifications that can change our lives.
Master in DevOps, SRE, DevSecOps & MLOps by DevOps School!
Learn from Guru Rajesh Kumar and double your salary in just one year.
Introduction
Modern enterprise IT ecosystems have grown incredibly complex. Microservice architectures, multi-cloud deployments, and ephemeral Kubernetes clusters generate billions of telemetry data points every single day. Managing this scale manually is no longer possible.
For decades, IT organizations relied on reactive monitoring. An infrastructure threshold was breached, a P1 alert fired, and engineers rushed into a war room to fix a system that was already broken. This approach costs modern enterprises millions of dollars in downtime and leads to engineering burnout.
To break this cycle, modern enterprises are turning to predictive operations. By analyzing historical telemetry, identifying subtle anomalies, and forecasting future states, platforms like TheAIOps allow teams to anticipate incidents before they impact users. Imagine a scenario where a memory leak in a critical payment microservice is identified and mitigated three hours before it can trigger a cascading database failure. That is the true power of predictive operations.
Featured Snippet
What Is Predictive Analytics in AIOps?
Predictive analytics in AIOps uses machine learning algorithms, historical telemetry data (metrics, logs, traces), and statistical modeling to forecast future IT infrastructure behaviors, identify subtle anomalies, and prevent system incidents before they degrade user experiences or cause operational downtime.
Understanding Predictive Analytics
What Is Predictive Analytics?
Predictive analytics is the branch of advanced data analysis that uses historical data, statistical algorithms, and machine learning techniques to determine the likelihood of future outcomes. In information technology, it translates raw system performance data into actionable forecasts regarding system health, capacity demands, and potential software regressions.
Evolution from Descriptive to Predictive Analytics
Operational analytics has evolved through three distinct evolutionary phases:
- Descriptive Analytics: Explains what happened in the past using historical charts and post-incident reports.
- Diagnostic Analytics: Investigates why it happened through root-cause isolation and log drilling.
- Predictive Analytics: Projects what will happen next by applying trained statistical models to real-time streams of observability data.
Why Prediction Matters in Operations
In a competitive digital economy, waiting for a system failure to trigger a response is an operational liability. Prediction shifts the engineering focus from firefighting to system optimization. It provides operations teams with the ultimate luxury in incident management: time.
Business Value of Forecasting Operational Issues
Forecasting system issues helps protect corporate revenue by preserving user experience consistency. It reduces the costs associated with operational fire drills, optimizes infrastructure spend by predicting true capacity needs, and allows engineering resources to focus on building new features rather than triaging legacy technical debt.
In Simple Terms
Predictive analytics is like having a weather forecasting app for your servers. Instead of waiting for a storm to flood your basement, the app warns you hours in advance so you can close the windows and stay dry.
Real-World Example
A streaming video platform uses predictive analysis to monitor user login spikes. The system forecasts that authentication traffic will exceed current cluster limits within 30 minutes, automatically spinning up new cloud instances before any users experience login failures.
Common Mistake
Confusing data visualization with data prediction. Looking at a line graph that shows a server’s CPU has been rising for three hours is descriptive analysis; using a mathematical model to calculate exactly when that CPU will hit 100% capacity is predictive analysis.
Key Takeaways
- Predictive analytics uses historical telemetry to forecast future IT operational states.
- It marks a major shift from reactive firefighting to proactive system optimization.
- Predicting operational issues gives engineering teams time to resolve issues before users are impacted.
Understanding AIOps
What Is AIOps?
Artificial Intelligence for IT Operations (AIOps) is the application of machine learning, natural language processing, and big data ingestion technologies to automate and enhance modern IT operations. It acts as a central brain that unifies disparate monitoring streams into a single, cohesive operational layer.
AI and Machine Learning in Operations
AIOps shifts operational management away from static, human-configured threshold rules. Instead, it uses algorithmic models that continuously learn the unique baseline behaviors of an organization’s applications, networks, and infrastructure layers.
Event Correlation
Modern data centers can generate thousands of alerts an hour during an incident, creating massive alert fatigue. AIOps algorithms analyze these data points in real time, grouping related alerts across different infrastructure layers into a single, cohesive operational incident.
Intelligent Automation
Once an incident is identified or predicted, AIOps platforms can trigger automated playbooks. This includes scaling up cloud clusters, restarting leaking services, or routing highly contextualized diagnostic data directly to the on-call engineer’s triage dashboard.
Observability and Monitoring
Traditional monitoring tracks whether a system is functioning based on predefined metrics. Observability allows engineers to infer a system’s internal state by analyzing its external outputs: metrics, logs, and traces. AIOps ingests this comprehensive observability data to build the baseline understanding required for accurate predictive analytics.
+-------------------------------------------------------------+
|               Observability Ingestion Layer                 |
|            (Metrics, Logs, Traces, Events)                  |
+------------------------------+------------------------------+
                               |
                               v
+-------------------------------------------------------------+
|                 AIOps Machine Learning Engine               |
|    (Event Correlation, Baseline Learning, Anomaly Detection) |
+------------------------------+------------------------------+
                               |
                               v
+-------------------------------------------------------------+
|                 Predictive Analytics Layer                  |
|     (Incident Prevention, Capacity and Risk Forecasting)    |
+-------------------------------------------------------------+
In Simple Terms
AIOps is like an experienced flight control system for an entire fleet of corporate software. It monitors thousands of sensors simultaneously, filters out background noise, and alerts the pilot to genuine issues.
Real-World Example
During a network switch failure, an enterprise environment receives 4,000 individual alerts from affected databases and applications. An AIOps platform correlates these alerts to the specific failing switch, presenting engineers with one actionable incident ticket instead of thousands of alarms.
Common Mistake
Treating AIOps as a simple replacement for traditional monitoring tools. AIOps does not replace your monitoring agents; it ingests data from them to provide cross-domain analysis and intelligent automation.
Key Takeaways
- AIOps combines big data ingestion with machine learning to enhance and automate IT operations.
- Event correlation groups thousands of separate alerts into a single root-cause incident.
- Comprehensive observability data forms the foundation that AIOps platforms need to generate predictions.
Predictive Analytics in AIOps Explained
Definition and Core Concept
Predictive analytics in AIOps applies specialized statistical models to real-time and historical observability data. It identifies early indicators of degradation, allowing operations teams to intervene before performance drops below acceptable service level agreements (SLAs).
Reactive vs Proactive Operations
Reactive operations depend on static alert triggers (e.g., alert if CPU > 85%). Proactive operations use algorithmic forecasting to identify issues early. A proactive system doesn’t wait for a threshold breach; it alerts you when a metric’s current trajectory indicates it will breach an operational threshold in the near future.
Predictive Monitoring
Predictive monitoring establishes a dynamic baseline of normal system behavior that accounts for time, day of the week, and seasonal traffic spikes. It alerts operations teams when a system diverges from these patterns, even if the absolute values appear safe.
Predictive Incident Prevention
By matching real-time performance anomalies with historical incident patterns, predictive incident management isolates potential issues early. This gives systems administrators the opportunity to deploy hotfixes, clear caches, or scale resources before an actual failure occurs.
Forecasting Operational Risks
Predictive AIOps models evaluate the systemic risk of upcoming changes, such as a major software deployment or cloud migration. By calculating how current dependencies will handle new operational patterns, teams can catch structural risks before pushing updates to production.
In Simple Terms
Reactive monitoring tells you that your car engine has overheated on the highway. Predictive monitoring tells you that your coolant level is dropping steadily and that your engine will overheat in about twenty minutes if you don’t pull over.
Real-World Example
An enterprise e-commerce backend shows normal CPU usage at 45%. However, a predictive monitoring model flags a subtle, continuous rise in memory allocation over 48 hours, identifying a slow memory leak weeks before it can crash the production database.
Common Mistake
Assuming predictive monitoring means setting tighter static thresholds. Tighter thresholds simply create more false alarms; predictive monitoring relies on trend trajectories and pattern analysis, not rigid ceilings.
Key Takeaways
- Predictive AIOps evaluates system trajectories over time to flag issues early.
- Dynamic baselines automatically adapt to normal usage cycles like weekends or holidays.
- Predictive monitoring provides early warnings based on behavior trends, rather than waiting for hard thresholds to break.
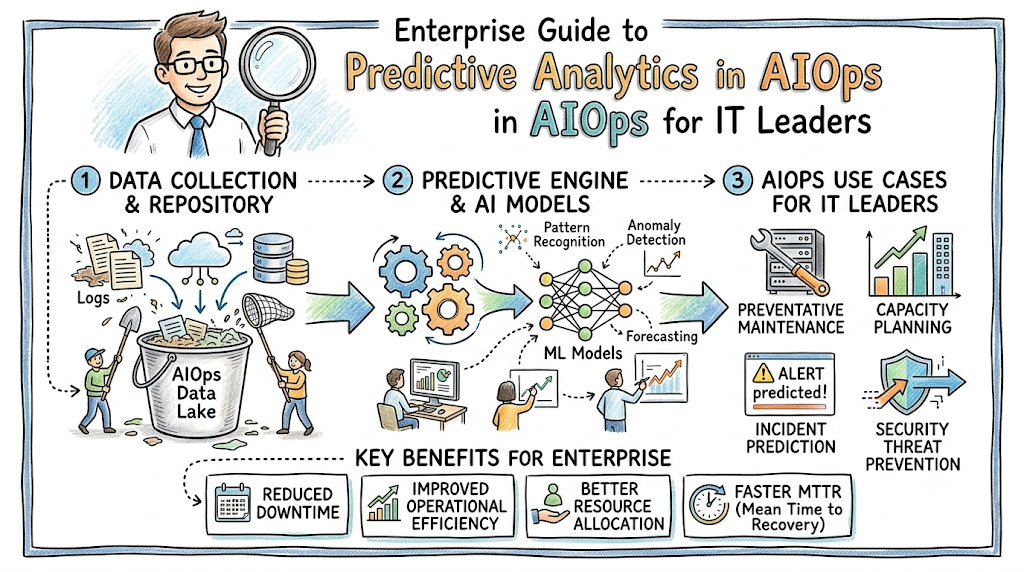
How Predictive Analytics Works in AIOps
+---------------------------------------------------------------------------------------------------------------------+
| 1. Data Collection ----> 2. Normalization ----> 3. Pattern Recognition ----> 4. ML Models ----> 5. Forecast & Automation |
+---------------------------------------------------------------------------------------------------------------------+
Step 1: Data Collection
The process begins by collecting raw telemetry across the enterprise architecture. AIOps agents ingest structured and unstructured performance data from servers, cloud platforms, containers, applications, and network components.
Step 2: Data Normalization
Raw telemetry arrives in various formats and time intervals. The normalization layer deduplicates, cleans, and structures this data, aligning timestamps to build a cohesive timeline of operational events.
Step 3: Pattern Recognition
The AIOps platform analyzes historical time-series data to identify normal operating baselines. It isolates cyclical trends—such as daily traffic spikes or weekly batch processing jobs—so normal business operations are not flagged as system anomalies.
Step 4: Machine Learning Models
Normalized data feeds into specialized machine learning engines. These models analyze real-time telemetry alongside historical patterns to track variances and project future performance paths.
Step 5: Forecast Generation
The machine learning models generate mathematical forecasts detailing the projected state of systems over the coming hours or days. If a system’s projected path indicates an upcoming incident, the platform triggers an early alert.
Step 6: Automated Recommendations
Alongside the warning, the system provides contextual recommendations or triggers automated workflows. This includes provisioning more resources, rolling back a recent code deployment, or executing script-driven remediation tasks.
In Simple Terms
The system collects data from across your infrastructure, cleans it up, learns what a normal day looks like, runs mathematical projections, and warns you if things are trending toward trouble—often providing instructions on how to fix it.
Real-World Example
An enterprise banking application processes a surge of mobile deposits on the first of the month. The AIOps engine recognizes this monthly pattern, projects disk write capacity demands, and advises the storage team to provision temporary volume space 12 hours ahead of time.
Common Mistake
Skipping the data normalization step. Feeding dirty, misaligned, or un-synchronized telemetry data into predictive machine learning models leads to inaccurate forecasts and unreliable alerts.
Key Takeaways
- Predictive pipelines require consistent, normalized data to build accurate system models.
- Pattern recognition separates normal operational cycles from true system anomalies.
- Automated recommendations help teams move quickly from an early warning to a resolved issue.
Types of Data Used for Predictive Analytics
- Metrics Data: Numerical time-series data measuring resource utilization over time, such as CPU load, memory utilization, disk I/O, and network throughput.
- Logs: Text records generated by applications and operating systems. These provide deep contextual clues regarding software exceptions, security events, and configuration states.
- Traces: End-to-end paths showing how a request travels through a distributed system. Traces help pinpoint exactly which microservice is introduces latency into a transaction chain.
- Events: Discrete operational occurrences with a clear timestamp, including code deployments, cloud instance scaling events, or manual configuration updates.
- Configuration Data (CMDB): Maps the structural dependencies between infrastructure components, showing how a failure in one virtual machine can ripple out to affect other applications.
- Historical Incident Data: Legacy post-mortem summaries, helpdesk tickets, and resolution timelines that teach machine learning models how past failures behaved and how they were resolved.
Machine Learning Techniques Behind Predictive AIOps
Regression Models
- Purpose: To predict a continuous numerical value based on historical trends.
- Strengths: Highly efficient for tracking linear and non-linear metric trends over time.
- Example Use Case: Forecasting exactly how many days remain before an enterprise log analytics cluster runs out of physical disk storage.
Classification Models
- Purpose: To sort operational data into discrete categories or risk profiles.
- Strengths: Excellent for identifying whether a specific system state matches known failure profiles.
- Example Use Case: Categorizing an incoming series of application exceptions as either a benign user error or a critical database connection drop.
Time-Series Forecasting
- Purpose: To model and project time-dependent data sequences into the future.
- Strengths: Accounts for seasonality, cyclical trends, and complex temporal dependencies across long periods.
- Example Use Case: Predicting application transaction volumes during major seasonal shopping events based on past performance data.
Clustering Algorithms
- Purpose: To group unlabelled data points together based on shared characteristics or proximity.
- Strengths: Uncovers hidden structural relationships and data groupings without requiring manual data labeling.
- Example Use Case: Sorting thousands of active microservices into baseline behavior groups to simplify large-scale infrastructure monitoring.
Anomaly Detection
- Purpose: To flag data points or patterns that deviate significantly from established normal baselines.
- Strengths: Catches brand-new system issues that haven’t been documented in historical incident logs.
- Example Use Case: Identifying a subtle, unusual variance in network traffic that points to a potential data exfiltration attempt.
Deep Learning Approaches
- Purpose: Using multi-layered neural networks to model highly complex, non-linear system relationships.
- Strengths: Capable of analyzing massive, high-dimensional datasets like unstructured log streams and distributed traces simultaneously.
- Example Use Case: Tracking health scores across an entire cloud ecosystem to predict cascading multi-service failures before they happen.
Predictive Analytics Use Cases in AIOps
Incident Prediction
Predictive analytics flags early system degradation, such as thread pool exhaustion or slow database connection drops, allowing on-call engineers to resolve issues before users experience errors.
Capacity Planning
Instead of using static estimates, AIOps platforms analyze historical growth patterns to forecast when compute, storage, or network resources will need expansion.
Performance Forecasting
By analyzing upcoming marketing campaigns or seasonal traffic patterns, performance forecasting models help teams ensure applications maintain low response times under heavy loads.
Resource Optimization
Predictive models identify over-provisioned infrastructure assets, allowing organizations to safely downsize underutilized cloud instances without risking application performance.
Service Reliability Management
Predictive AIOps monitors Service Level Indicators (SLIs) to calculate error-budget burn rates, warning site reliability engineers if a current trend risks breaching quarterly SLAs.
Infrastructure Health Monitoring
By analyzing temperature readings, disk write errors, and power variations, predictive maintenance models identify physical hardware failures days before a component breaks down completely.
Predictive Analytics vs Traditional Monitoring
| Operational Area | Traditional Monitoring | Predictive Analytics |
| Detection Timing | Reactive: Alerts fire after a threshold has been crossed and an issue is occurring. | Proactive: Alerts fire based on projected trajectories before a failure happens. |
| Data Usage | Evaluates isolated, real-time data points independently. | Analyzes real-time streams alongside large historical datasets for deep context. |
| Alert Strategy | Relies on static, manually configured thresholds that require ongoing tuning. | Uses dynamic baselines that automatically adapt to normal usage variations. |
| Automation Level | Limited to simple, rule-based scripts triggered by specific alert events. | Triggers contextual playbooks and orchestrates automated infrastructure scaling. |
| Root Cause Analysis | Requires manual log sorting and cross-team war rooms to trace issues. | Uses dependency mapping and correlation models to automatically isolate root causes. |
| Business Impact | Focuses on minimizing downtime after a critical system outage has begun. | Focuses on preventing downtime entirely, maintaining a consistent user experience. |
Predictive Analytics and Observability
Predictive analytics cannot operate effectively in an isolated silo. It relies heavily on high-fidelity telemetry provided by an enterprise observability strategy. Without a comprehensive view across metrics, logs, and traces, predictive models miss the contextual clues required for accurate forecasting.
When an AIOps platform analyzes log intelligence alongside metrics data, it can match a rising error trajectory to specific exception patterns hidden in application logs. Distributed tracing allows predictive models to follow performance bottlenecks across complex microservice chains, mapping how a small delay in an upstream service might impact downstream database health.
This unified visibility across all layers allows machine learning models to map dependencies accurately. When predictive analytics is combined with full-stack observability, it moves beyond basic statistical projections, providing a deep understanding of how your entire ecosystem interacts.
Benefits of Predictive Analytics in AIOps
- Reduced Downtime: Catching infrastructure and application failures early allows teams to mitigate issues before they impact end users.
- Lower Mean Time to Resolution (MTTR): Automated root cause analysis isolates systemic failures quickly, cutting down the hours spent sorting through disconnected alerts.
- Faster Incident Response: Automated alerts provide engineers with the exact context and remediation playbooks they need, speeding up response workflows.
- Better Capacity Planning: Data-driven projections remove the guesswork from resource allocation, protecting budgets and application performance.
- Cost Optimization: Identifying underutilized resources allows teams to safely reclaim idle cloud infrastructure and lower operational overhead.
- Improved User Experience: Preventing performance degradation ensures digital platforms remain fast, reliable, and available for customers.
- Increased System Reliability: Transitioning from reactive firefighting to proactive maintenance allows engineering teams to focus on structural platform stability.
Real-World Industry Applications
Financial Services
- Operational Challenge: Microsecond delays in payment processing applications can disrupt transaction workflows and lead to regulatory compliance penalties.
- Predictive Solution: An AIOps model monitors transaction queues and messaging layers, forecasting queue backups based on real-time trade volumes.
- Benefits Achieved: Eliminated high-priority settlement outages and maintained consistent transaction velocities during peak trading hours.
Healthcare
- Operational Challenge: Downtime in electronic health record (EHR) systems can disrupt clinical workflows and impact patient care delivery.
- Predictive Solution: Implementing predictive analytics across core hospital databases to flag anomalous query paths and connection pool saturation.
- Benefits Achieved: Realized a significant reduction in critical medical application downtime and improved clinical database performance.
Telecommunications
- Operational Challenge: Sudden cellular network congestion during major public events can overwhelm regional cell sites and degrade call quality.
- Predictive Solution: Time-series forecasting models analyze historical cell tower data alongside localized event schedules to project demand spikes.
- Benefits Achieved: Automated the pre-emptive allocation of network bandwidth, reducing dropped call rates during high-traffic events.
E-Commerce
- Operational Challenge: Flash sales and holiday shopping surges can overwhelm checkout microservices, leading to abandoned shopping carts and lost revenue.
- Predictive Solution: Predictive monitoring tracks inventory services and API gateway latency, adjusting cloud capacity dynamically ahead of traffic spikes.
- Benefits Achieved: Protected revenue streams during high-profile promotional campaigns by eliminating resource-driven checkout failures.
SaaS Platforms
- Operational Challenge: Multi-tenant database clusters run the risk of noisy-neighbor issues, where one client’s heavy usage impacts surrounding users.
- Predictive Solution: Clustering and anomaly detection models isolate unusual tenant usage patterns before they can consume shared resources.
- Benefits Achieved: Safeguarded multi-tenant service reliability and minimized customer churn caused by performance degradation.
Manufacturing
- Operational Challenge: Unexpected outages in ERP and inventory tracking software can stall physical factory production lines and disrupt distribution networks.
- Predictive Solution: Predictive maintenance algorithms monitor data pipelines and server health across manufacturing execution systems.
- Benefits Achieved: Prevented supply chain delays by identifying and resolving enterprise software failures before production schedules were impacted.
Common Challenges in Predictive AIOps
Challenge 1: Poor Data Quality
Machine learning models depend heavily on the quality of their input data. Incomplete telemetry, inconsistent timestamps, and missing logs will cause predictive platforms to generate inaccurate forecasts.
- The Solution: Build a unified data validation strategy. Use standardized logging formats (like OpenTelemetry) across your entire infrastructure to ensure data is clean and consistent before it reaches your models.
Challenge 2: Data Silos
When database teams, network groups, and application engineers use separate, disconnected monitoring tools, your AIOps platform cannot build a complete picture of system dependencies.
- The Solution: Consolidate your telemetry into a central observability platform. This gives your machine learning models the cross-domain access they need to trace complex incidents.
Challenge 3: Insufficient Historical Data
Predictive models need historical context to learn baseline behaviors and identify cyclical business trends. Without enough past data, systems struggle to separate normal traffic surges from true anomalies.
- The Solution: Maintain a clean history of core operational metrics for at least 30 to 90 days before activating advanced predictive forecasting features.
Challenge 4: Model Accuracy Issues
An overly sensitive predictive model can trigger false alarms for minor, harmless variances, creating alert fatigue and reducing engineering trust in the system.
- The Solution: Continuously tune model hyperparameters and use feedback loops. Allow engineering teams to flag false positives so the platform can adapt and improve its predictions over time.
Common Mistakes Organizations Make
Treating Predictive Analytics as Magic
Many organizations assume that deploying an AIOps platform will instantly fix all their infrastructure problems without requiring ongoing configuration or oversight.
- Prevention Strategy: Treat predictive analytics as an iterative engineering practice. Plan for an initial training phase where models learn your system’s unique behaviors, and dedicate engineering time to ongoing refinement.
Ignoring Data Readiness
Attempting to deploy advanced machine learning models on top of a fragmented monitoring infrastructure that lacks clean, normalized telemetry data.
- Prevention Strategy: Focus on full-stack observability first. Ensure your metrics, logs, and traces are reliable and standardized before layering predictive analytics on top.
Using Too Few Data Sources
Relying solely on high-level infrastructure metrics (like server CPU usage) while ignoring application logs, traces, and deployment histories limits the context available to your models.
- Prevention Strategy: Feed your predictive engine a comprehensive mix of data, including infrastructure metrics, application logs, end-to-end traces, and CI/CD deployment events.
Failing to Validate Predictions
Accepting every automated alert and recommendation blindly without building verification steps to confirm that your models are identifying genuine operational risks.
- Prevention Strategy: Run regular reviews to match past system predictions against actual operational outcomes. Use these insights to fine-tune your alerting thresholds.
Not Measuring Business Outcomes
Focusing entirely on technical metrics like algorithm accuracy while failing to track meaningful business benefits like reduced downtime or optimized cloud costs.
- Prevention Strategy: Connect your predictive AIOps performance directly to business key performance indicators (KPIs), such as SLA compliance rates, customer satisfaction scores, and infrastructure cost reductions.
Building a Predictive Analytics Strategy
+---------------------------------------------------------------------------------------------------------------------+
| 1. Define Objectives -> 2. Audit Telemetry -> 3. Standardize Data -> 4. Pilot Use Cases -> 5. Automate & Iterate   |
+---------------------------------------------------------------------------------------------------------------------+
Phase 1: Define Objectives
Identify the core operational challenges you want to solve, such as reducing critical database incidents or optimizing cloud infrastructure costs. Setting clear goals keeps your implementation focused.
Phase 2: Audit Existing Telemetry
Review your current monitoring tools to ensure you are collecting high-quality metrics, logs, and traces. Identify any coverage gaps across your applications or infrastructure layers.
Phase 3: Standardize the Data Layer
Adopt open data standards like OpenTelemetry across your environments. Standardizing your formats ensures your AIOps platform receives clean, consistent data from every service.
Phase 4: Pilot High-Value Use Cases
Start with a focused, high-impact project, such as predicting storage capacity limits on core databases or tracking latency trends in consumer-facing APIs.
Phase 5: Implement Automated Playbooks
Once your models demonstrate consistent accuracy, connect their outputs to automated workflows—such as auto-scaling resources or triggering self-healing recovery scripts.
Phase 6: Continuous Iteration
Regularly review your model performance alongside your engineering teams. Use real-world incident feedback to update baselines and refine your alerting strategies over time.
Popular Tools Supporting Predictive Analytics in AIOps
- Dynatrace: Uses its Davis AI causal engine to provide automatic root cause analysis and predictive anomaly detection across large cloud environments. Highly effective for complex enterprise architectures.
- Datadog: Offers built-in machine learning features for time-series forecasting and anomaly tracking. An excellent choice for fast-moving DevOps and cloud-native engineering teams.
- Splunk ITSI: Combines powerful log aggregation with machine learning models to predict service degradations and correlate events across disparate enterprise data sources.
- New Relic: Provides AI-driven anomaly detection and alert correlation features that integrate smoothly into its unified telemetry database, making it ideal for full-stack visibility.
- Moogsoft: Specializes in cross-domain event correlation and alert noise reduction, allowing enterprises to streamline their incident management workflows.
- BigPanda: Uses open integration capabilities to aggregate alerts from multiple monitoring tools, correlating them into clear incidents to prevent alert fatigue.
- IBM Cloud Pak for AIOps: Delivers advanced predictive modeling and automation tools designed to manage risk and maintain reliability across complex hybrid cloud platforms.
- BMC Helix AIOps: Focuses on service-centric predictive analytics, combining infrastructure health monitoring with dependency mapping to protect enterprise business workflows.
Skills Needed for Predictive AIOps
- Monitoring Fundamentals: A strong understanding of core telemetry concepts, alert lifecycles, and traditional systems administration.
- Data Analysis: Comfort working with time-series data, basic statistical modeling, and data visualization strategies.
- Machine Learning Basics: Familiarity with core concepts like regression, classification, clustering, and how models use training datasets.
- Observability Practices: Experience instrumenting applications using open frameworks like OpenTelemetry to capture metrics, logs, and traces.
- Incident Management: A deep understanding of modern incident response workflows, blameless post-mortems, and site reliability engineering (SRE) methodologies.
- Cloud Architecture: Knowledge of distributed cloud environments, container orchestration platforms like Kubernetes, and automated infrastructure management.
Future of Predictive Analytics in AIOps
Generative AI Integration
Generative AI will change how engineers interact with operational data. Instead of analyzing complex charts during an incident, on-call teams can use natural language queries to ask their AIOps platform for real-time status updates and mitigation steps.
Autonomous Operations
IT operations will continue moving toward fully autonomous management. AIOps platforms will handle routine infrastructure tuning, security patching, and resource allocation independently, freeing engineering teams to focus on core product development.
Self-Healing Infrastructure
When a predictive model flags an upcoming failure, the system will execute self-healing workflows automatically. It can isolate a degrading microservice, spin up a healthy replacement, and route traffic away from the issue without requiring manual intervention.
AI Agents for Operations
Specialized AI agents will continuously monitor specific domains within your infrastructure. These agents will collaborate with one another, sharing contextual insights to resolve complex, cross-system performance issues automatically.
Hyper-Automation
Hyper-automation will link predictive analytics directly to broader business workflows. If the system forecasts a capacity shortfall during a major product launch, it can automatically initiate procurement approvals and provision cloud resources to protect the user experience.
Case Study Section
Case Study 1: Banking Outage Prevention Program
- Problem: A retail banking provider experienced recurring weekend database slowdowns that disrupted mobile banking access and lowered client satisfaction.
- Data Sources: Database transaction logs, connection pool metrics, and virtual machine CPU utilization statistics.
- Predictive Model Approach: Deployed a time-series forecasting model to monitor query trends and identify early indicators of connection pool exhaustion.
- Results: Caught and mitigated 94% of potential database bottlenecks before they impacted users, lowering weekend incident volumes significantly.
- Lessons Learned: Access to historical system performance data is essential for building accurate predictive models that account for cyclical business traffic spikes.
Case Study 2: E-Commerce Traffic Forecasting Initiative
- Problem: A global e-commerce retailer faced unexpected microservice failures during major promotional events due to sudden, volatile traffic spikes.
- Data Sources: API gateway latency metrics, web server logs, and active shopping cart transaction counts.
- Predictive Model Approach: Implemented regression models and anomaly detection features to monitor infrastructure health alongside incoming traffic volumes.
- Results: Scaled cloud infrastructure capacity automatically ahead of traffic spikes, maintaining fast page response times throughout high-volume promotional sales.
- Lessons Learned: Connecting business event timelines directly to your monitoring platforms improves the accuracy of predictive capacity planning.
Case Study 3: Telecommunications Capacity Prediction Project
- Problem: A major telecommunications provider struggled with regional data network congestion caused by unpredictable surges in streaming media consumption.
- Data Sources: Cellular tower throughput metrics, network packet drop rates, and localized data usage statistics.
- Predictive Model Approach: Used clustering and time-series models to identify regional network consumption patterns and project future usage trends.
- Results: Optimized capital expenditures by routing network traffic dynamically, reducing localized data congestion by 35%.
- Lessons Learned: Grouping infrastructure assets by usage behavior allows teams to scale large-scale predictive models more effectively.
Case Study 4: SaaS Reliability Improvement Program
- Problem: A multi-tenant enterprise software provider suffered from alert fatigue, with engineers sorting through thousands of disconnected daily alerts.
- Data Sources: Application performance monitoring metrics, container orchestrator events, and system error logs.
- Predictive Model Approach: Implemented machine learning classification and correlation models to group related system alerts into unified incidents.
- Results: Reduced total alert noise by 82% and improved mean time to resolution (MTTR) for critical performance issues by over an hour.
- Lessons Learned: Reducing background alert noise is a necessary step before engineering teams can focus on long-term predictive warnings.
Case Study 5: Healthcare Infrastructure Monitoring Transformation
- Problem: A large hospital network experienced unexpected storage failures on its digital medical imaging platforms, disrupting clinical operations.
- Data Sources: Storage area network (SAN) performance metrics, hardware system logs, and storage controller temperature readings.
- Predictive Model Approach: Applied anomaly detection and predictive maintenance algorithms to identify early physical drive degradation patterns.
- Results: Identified and resolved physical hardware issues days before drive failures occurred, protecting critical patient care systems from disruption.
- Lessons Learned: Combining physical hardware metrics with application logs provides the end-to-end visibility required to protect critical business operations.
Predictive Analytics Readiness Assessment
Evaluate your organization’s readiness across five core areas using our scoring scale:
- Level 1 (Reactive): Ad-hoc tracking, no formal strategy, high incident counts.
- Level 2 (Monitored): Basic alerting on core metrics, manual incident response workflows.
- Level 3 (Observable): Centralized telemetry streams, clean tracking, unified dashboards.
- Level 4 (Predictive): Early anomaly detection, automated root-cause analysis, dynamic baselines.
- Level 5 (Autonomous): Self-healing workflows, AI-driven capacity optimization, continuous automated refinement.
Self-Assessment Scoring Matrix
| Assessment Area | Level 1 | Level 2 | Level 3 | Level 4 | Level 5 |
| Data Maturity | Broken, siloed data logs. | Centralized server metrics. | Structured logs and metrics. | Unified, real-time data streams. | Continuous automated data tuning. |
| Monitoring Maturity | No formal alerts in place. | Static, rigid alert ceilings. | Dynamic baseline tracking. | Automated alert grouping. | AI-driven system status tracking. |
| Observability Maturity | No code-level visibility. | Basic application charts. | Distributed transaction traces. | Full-stack dependency maps. | Automated trace insight analysis. |
| Automation Maturity | Manual fix deployment scripts. | Basic alert response scripts. | Automated scaling playbooks. | Predictive fix deployments. | Full self-healing infrastructure. |
| Organizational Readiness | Siloed engineering groups. | Collaborative triage sessions. | Shared reliability targets. | Blameless engineering reviews. | AI-assisted operational design. |
Scoring Guidance
- Score 5–10 (Reactive Firefighter): Focus on building foundational monitoring baselines and centralizing your core metrics data.
- Score 11–18 (Monitored Operator): Prioritize full-stack observability by introducing distributed tracing and structured log management.
- Score 19–25 (Predictive Pioneer): Your infrastructure is ready. Begin integrating machine learning models to automate root-cause isolation and capture early system anomalies.
FAQ Section
- What is predictive analytics in AIOps?
Predictive analytics in AIOps combines machine learning models with historical telemetry data to forecast future infrastructure behaviors and catch system failures before they impact end users. - How does predictive monitoring differ from traditional monitoring?
Traditional monitoring relies on rigid, static thresholds that trigger alerts after a failure occurs. Predictive monitoring tracks real-time trends against dynamic baselines to warn teams before an incident happens. - What core data sources are required for predictive AIOps?
Predictive AIOps platforms require a balanced mix of system metrics, application logs, distributed traces, system events, topology maps, and historical incident records. - Which machine learning models are most commonly used?
These platforms typically use time-series forecasting, linear and non-linear regression, classification models, clustering algorithms, and advanced deep learning neural networks. - Can predictive analytics completely eliminate system outages?
While it cannot eliminate every potential software bug or hardware failure, predictive analytics drastically reduces downtime by giving operations teams the early warnings they need to mitigate risks. - What are the biggest hurdles when implementing predictive AIOps?
The most common challenges include managing poor data quality, breaking down infrastructure data silos, overcoming alert fatigue from unoptimized models, and guiding teams through cultural shifts. - Is implementing predictive AIOps expensive for an enterprise?
The upfront investment in tooling and training is offset by the business value gained from reduced system downtime, optimized cloud infrastructure costs, and improved engineering efficiency. - Which industries see the largest benefit from predictive operations?
Any digital enterprise with complex, high-volume transactions benefits greatly, including financial services, e-commerce networks, healthcare platforms, telecommunications providers, and SaaS companies. - How long does it take for predictive models to become accurate?
Most machine learning models require between 14 to 30 days of consistent historical telemetry to learn your infrastructure’s baseline behaviors and minimize false alarms. - What specific technical skills do operations teams need?
Engineers benefit from a solid foundation in systems administration, data analysis practices, observability tools (like OpenTelemetry), and modern site reliability engineering methodologies. - How do predictive platforms help reduce alert fatigue?
AIOps engines use event correlation to group thousands of separate, simultaneous alerts into a single, comprehensive incident report that outlines the true root cause. - What role does distributed tracing play in predictive analytics?
Distributed tracing maps how requests travel through complex microservices, allowing predictive models to spot growing latency bottlenecks before they disrupt downstream applications. - Can predictive AIOps help optimize cloud infrastructure spend?
Yes. Predictive models analyze long-term usage trends to identify over-provisioned infrastructure assets, allowing teams to safely downsize instances without risking application performance. - What are dynamic baselines in predictive monitoring?
Dynamic baselines are AI-calculated thresholds that automatically adapt to normal usage variations, such as lower business traffic on weekends or expected spikes during seasonal sales. - How does predictive maintenance apply to IT operations?
Predictive maintenance uses hardware sensor data and system error logs to identify failing physical storage drives or network switches days before they break down completely. - What is anomaly detection in predictive AIOps?
Anomaly detection is a machine learning process that flags subtle behavior variances that deviate from normal operating baselines, highlighting potential issues before they trigger a hard alert. - How do automated playbooks connect to predictive workflows?
When a predictive model flags an upcoming failure, it can automatically trigger an orchestrated playbook to scale up resources or restart a leaking service, resolving the issue without human intervention. - What is a memory leak, and how does AIOps predict it?
A memory leak occurs when an application fails to release unneeded memory over time. Predictive models track this steady, upward utilization trend and flag the issue weeks before the system can crash. - How do open standards like OpenTelemetry assist predictive AIOps?
OpenTelemetry standardizes data collection formats across metrics, logs, and traces, ensuring your predictive machine learning models receive clean, consistent telemetry from every service. - What is the future of predictive analytics in IT operations?
The future points toward fully autonomous, self-healing environments driven by advanced AI agents that identify, troubleshoot, and resolve complex performance issues independently.
Final Summary
Predictive analytics in AIOps represents a fundamental shift in how modern enterprises manage digital infrastructure. Moving away from reactive firefighting allows organizations to leverage machine learning models, time-series forecasting, and comprehensive observability data to build a proactive operational strategy.
Implementing these practices requires clean, standardized telemetry and a structured deployment plan, but the operational returns—including reduced downtime, lower MTTR, and optimized infrastructure costs—are invaluable.