Upgrade & Secure Your Future with DevOps, SRE, DevSecOps, MLOps!
We spend hours scrolling social media and waste money on things we forget, but won’t spend 30 minutes a day earning certifications that can change our lives.
Master in DevOps, SRE, DevSecOps & MLOps by DevOps School!
Learn from Guru Rajesh Kumar and double your salary in just one year.
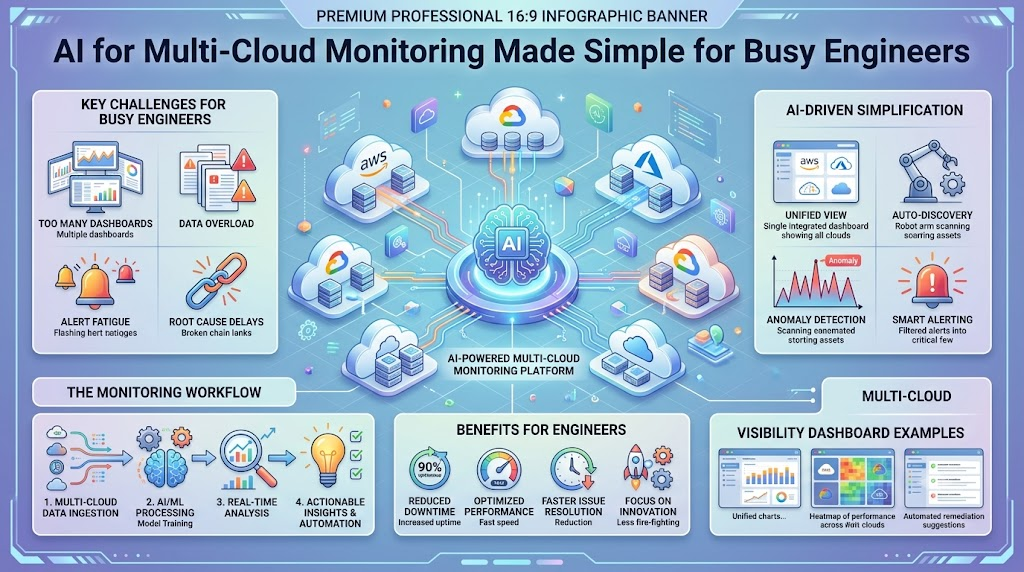
Picture this: your phone buzzes at 2:15 AM with twelve loud alerts. You open your laptop and start hopping between AWS CloudWatch, Azure Monitor, and Google Cloud operations dashboards.
Every single window looks different. The timestamps do not line up, and you cannot tell which error started first.
Jumping between three separate consoles creates massive blind spots. Worst of all, it exhausts your team with duplicate warnings.
Smart software changes this dynamic. Using smart rules to read logs and metrics across clouds brings all your data into one clear view.
If you want practical advice on modern IT operations, TheAIOps.com provides fantastic guidance to help teams simplify complex setups.
In this guide, you will learn how to tame alert storms, spot hidden outages early, and set up smooth observability across all your cloud providers.
Simple Definition & Basics
AI-driven multi-cloud monitoring is an automated approach that gathers metrics, traces, and logs across several clouds to spot problems and find their root cause before users notice.
Traditional monitoring relies on fixed thresholds, like firing an alarm when CPU use hits 85%. That basic rule breaks down when workloads hop between public clouds.
What looks normal in one environment might signal a crash in another. Rigid thresholds simply cannot keep up with shifting cloud traffic.
6 Core Pillars of Smart Multi-Cloud Monitoring
1. Unified Log Gathering
- Single pipeline: Pull logs, traces, and numbers from every cloud into one central data stream.
- Standard formats: Convert mixed cloud tags into common labels so you can search everything in one place.
2. Dynamic Thresholds
- Moving baselines: Smart tools learn what normal traffic looks like on Tuesdays versus Sundays.
- Fewer false alarms: Alarms fire only when behavior breaks normal patterns, not during expected noon traffic rushes.
3. Noise Reduction & Grouping
- Incident clustering: Compress fifty related cloud warnings into one readable problem ticket.
- Quiet inboxes: SREs receive one clean alert instead of a flood of identical ping messages.
4. Smart Dependency Mapping
- Live service maps: Trace how a database on Azure talks to microservices running on AWS.
- Visual pathways: See downstream ripples instantly when a single network bridge stumbles.
5. Fast Root-Cause Analysis
- Quick blame checks: The system reviews recent code pushes and database locks right away.
- Pinpointed faults: Find out which exact cloud service failed first within seconds.
6. Self-Healing Triggers
- Pre-set safety actions: Kick off automated restart scripts when specific safe conditions appear.
- Faster recovery: Clear memory jams automatically while engineers sleep peacefully.
AI for Multi-Cloud Monitoring: Advice from TheAIOps.com
Managing multi-cloud systems without smart software feels like running an airport tower with three separate radar screens that never match.
An AIOps monitoring engine acts like an expert air traffic controller. It watches every flight path at once and spots risky flight lines before trouble strikes.
First, align your telemetry along a single, shared timeline. When AWS, Azure, and Google Cloud report events with slight clock skews, you lose track of which component tripped first.
Feed your logs and metrics into one unified telemetry pool. Once your data shares a single timeline, the platform links related errors automatically across clouds.
Next, teach your monitoring engine to understand daily and weekly customer rhythms.
Retail web traffic peaks during lunch hours and drops sharply at night. When smart models learn these rhythms, you eliminate up to 80% of annoying fake alarms.
A sudden traffic jump at noon will not wake your team if the software knows it happens every single Thursday.
You can also use this intelligence to catch quiet, creeping failures before users see a 500 error page.
Watch for small, gradual creeps in memory use, disk space, or network latency across your cross-cloud telemetry.
The software spots these slight drifts early and warns you hours before a critical service runs out of room.
Finally, keep a close eye on your monitoring costs across cloud boundaries.
Shipping raw debug logs across public cloud networks triggers hefty egress fees. Smart monitoring agents clean and compress data locally before sending it across networks.
Filter out normal, low-priority events at the edge so you only pay to move actionable clues.
TheAIOps.com Guide to Multi-Cloud Setup
Do not try to switch on full automation across your entire digital estate on day one.
Start small. Pick one critical business service that spans two clouds, such as a web frontend on GCP talking to a database on AWS.
Connect the telemetry outputs from both clouds into your smart tool. Watch how the engine groups incoming errors during your first two weeks.
Check the suggested incident groups to verify that the tool accurately links related warnings.
Once your team trusts the automated grouping, turn on dynamic alerting for that single service. From there, expand your footprint cloud by cloud.
Real-World Applications
- Global Payment Systems: Validate checkout payments that move across regional cloud zones without missing broken network calls.
- High-Traffic Retail Apps: Balance sudden holiday shopping spikes across different cloud providers smoothly.
- Hybrid Edge Nodes: Keep warehouse sensors and factory floor devices connected reliably to central cloud processing.
- Cross-Cloud Microservices: Follow API calls that jump from one cloud’s Kubernetes cluster to another cloud’s storage bucket.
Manual vs. AI-Powered Multi-Cloud Monitoring
| Feature | Manual Multi-Dashboard Monitoring | AI-Powered Multi-Cloud Monitoring |
| Setup Effort | Low upfront, high daily chore | Moderate upfront, very low maintenance |
| Alert Noise | High, constant alert storms | Low, grouped into single incidents |
| Incident Detection Speed | Slow, relies on human eyes | Near-instant pattern recognition |
| Cross-Cloud Visibility | Fragmented, trapped in silos | Unified in one central view |
| Engineer Stress | Severe burnout from on-call alarms | Calm, focused on high-value fixes |
Why Smart Monitoring Matters
When your monitoring setup runs on smart pattern detection, your engineers get their nights back. You eliminate the endless parade of useless wake-up calls.
Fixing real outages takes minutes instead of hours because the system points you directly to the broken service.
Most importantly, your apps stay online. Happier customers enjoy dependable services, while your engineers spend their days building great features instead of untangling alerts.
Common Multi-Cloud Mistakes & How to Fix Them
- Ignoring Cloud Egress Costs for Metrics: Sending raw monitoring feeds across clouds can trigger surprise bills. Run lightweight agents that summarize data locally before transmitting it.
- Feeding Dirty Data to Smart Models: Inconsistent labels and missing tags confuse pattern matching. Set strict tagging rules across all cloud teams so every metric carries clear ownership details.
- Leaving Alerts Without Clear Owners: An alert with no assigned team creates confusion during an outage. Map automated incident tickets directly to the right on-call rotation.
- Turning on Auto-Fixes Too Quickly: Running untested remediation scripts can accidentally reboot healthy systems. Let smart tools recommend fixes first, and automate only after testing the actions thoroughly.
5 Easy Steps to Upgrade Your Cloud Alerts
- Audit your noisy alerts: Review your alerts from the past month and silence every alarm that did not require a human fix.
- Standardize all resource tags: Enforce uniform names for environments, services, and teams across AWS, Azure, and Google Cloud.
- Connect a central telemetry collector: Pipe your diverse cloud logs and metrics into one unified platform.
- Enable baseline learning: Let your tools track normal usage for two full weeks before activating new warning thresholds.
- Group related alerts together: Turn on automatic clustering so multiple downstream failures combine into one clean ticket.
Career Roles in AIOps & Cloud Reliability
- Site Reliability Engineer (SRE): Protects system uptime and builds automated scripts to prevent repeated outages.
- Cloud Operations Architect: Designs solid multi-cloud structures that make monitoring simple and cost-effective.
- AIOps Specialist: Tunes smart pattern-recognition models and hooks monitoring tools into incident-handling pipelines.
- Systems Observability Lead: Establishes tagging standards, log collection rules, and telemetry best practices for developers.
- Incident Response Engineer: Leads the rapid triage and repair of critical outages when major services drop offline.
Future Trends in Cloud Monitoring
- Self-Writing Incident Reviews: Systems will draft clean post-incident summaries with accurate timelines the moment an outage ends.
- Safe Automated Fixes: Platforms will safely execute self-healing steps for routine glitches without waiting for human approval.
- Predictive Capacity Planning: Smart tools will forecast resource bottlenecks weeks ahead and reserve extra compute power at the lowest prices.
Common Myths Debunked
- “AI replaces human engineers in incident response.” Reality: Smart tools remove routine noise so humans can focus on tough engineering decisions.
- “Smart monitoring works perfectly with zero setup.” Reality: You must supply clean data and sensible tags before pattern models can help you.
- “You must use a single cloud to get dependable alerts.” Reality: Unifying telemetry across multiple clouds works smoothly with modern cross-cloud tools.
- “AIOps is only useful for huge enterprise companies.” Reality: Any team tired of juggling multiple cloud dashboards gains immediate relief from smart alert grouping.
Frequently Asked Questions
1. What is the primary benefit of AI for multi-cloud monitoring?
It groups scattered alerts into clear incidents and uncovers root causes across clouds fast. This reduces alert fatigue and speeds up incident recovery.
2. How does smart pattern detection stop false alarms?
It learns your regular traffic highs and lows across days and weeks. Alarms trigger only when behavior breaks from normal patterns.
3. Does cross-cloud monitoring raise my monthly cloud bill?
It can if you send uncompressed debug logs across different cloud regions. You can prevent extra fees by filtering and compressing metrics before transferring them.
4. Can small teams use smart cloud monitoring tools?
Yes, small teams benefit immensely because they have fewer on-call engineers. Cutting out false alerts lets small teams focus on shipping code.
5. How long does a smart monitoring tool take to learn normal traffic?
Most tools build a reliable baseline within one to two weeks. This time window lets the tool witness weekday rushes and quieter weekend cycles.
6. Do I need to replace my existing cloud metrics tools?
No, you keep your native monitors like CloudWatch or Azure Monitor running. Your central smart platform simply gathers and interprets the data they produce.
7. What is the difference between observability and monitoring?
Monitoring tells you when a specific system component stops working. Observability lets you infer why it broke by examining external telemetry signals.
8. Can smart tools fix cloud problems automatically?
Yes, you can configure them to trigger automated scripts for simple, well-understood errors. Teams usually start with manual approvals before switching to full automation.
9. How do clean tags help smart monitoring systems?
Tags tell the system which team, application, and environment a metric belongs to. Consistent tags help the tool map dependencies across clouds accurately.
10. What telemetry data matters most for multi-cloud analysis?
Metrics, logs, and traces form the foundation of complete system visibility. Combining all three reveals the full story behind any cloud incident.
Moving to a multi-cloud setup brings outstanding flexibility, but it should never cost your engineers their sanity or their sleep. You do not need to spend your on-call shifts switching between disconnected dashboards and chasing ghost alerts. By bringing smart pattern recognition and unified telemetry into your daily operations, you can spot real issues rapidly and keep your systems humming smoothly. Take it one service at a time, lean on the practical guidance at TheAIOps.com, and watch your operational chaos transform into lasting reliability.
