Upgrade & Secure Your Future with DevOps, SRE, DevSecOps, MLOps!
We spend hours scrolling social media and waste money on things we forget, but won’t spend 30 minutes a day earning certifications that can change our lives.
Master in DevOps, SRE, DevSecOps & MLOps by DevOps School!
Learn from Guru Rajesh Kumar and double your salary in just one year.
Introduction
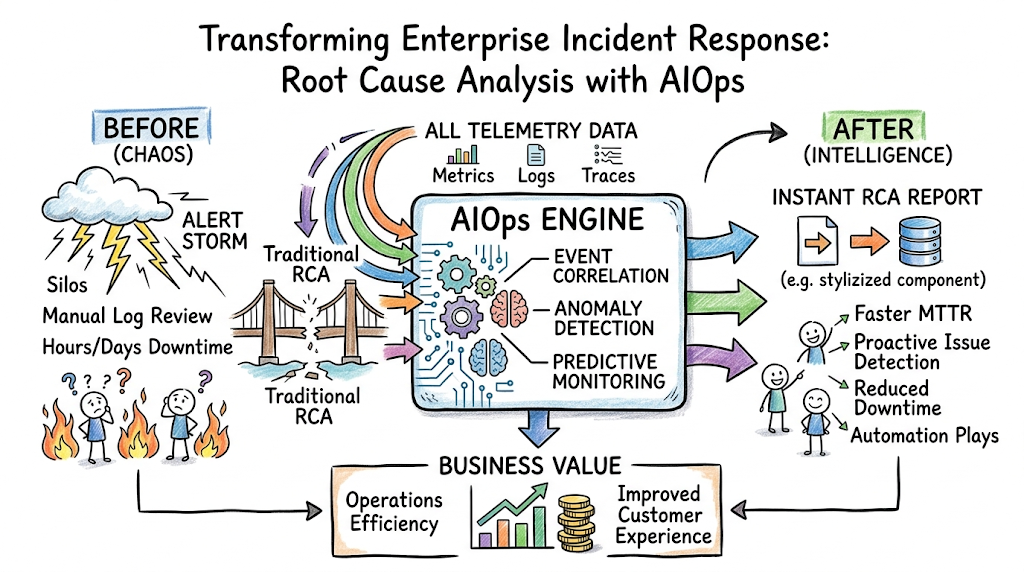
In the world of enterprise IT operations, handling system failures can feel like trying to find a needle in a digital haystack. Every single minute of system downtime can cost a large enterprise thousands of dollars in lost revenue, damaged customer trust, and dropped service level agreements. When an application crashes or a service slows down, IT infrastructure does not just sit there quietly. It screams for help. Firewalls, servers, databases, load balancers, and container orchestration platforms all begin firing off warning messages at the exact same time. This sudden rush of notifications is what IT specialists call an alert storm.
By applying machine learning algorithms to infrastructure data, platforms can now achieve intelligent troubleshooting. This guide will walk you through how Root Cause Analysis with AIOps simplifies incident investigation, helping enterprises move from reactive firefighting to predictive monitoring. Whether you are an IT professional looking to upgrade your skills or a technology manager looking to stabilize your infrastructure, understanding intelligent operations is essential.
To help teams master these complex workflows and learn how to implement automated troubleshooting effectively, platforms like TheAIOps provide deep training, practical frameworks, and educational resources designed to guide engineers through this modern technological shift. Let us explore how intelligent automation can turn operational chaos into clean, actionable insights.
What Is Root Cause Analysis in AIOps?
Root cause analysis is the systematic process of identifying the fundamental, underlying reason why an IT incident occurred. The goal is not just to fix the immediate symptom, but to fix the core vulnerability so the issue never happens again. In an AIOps ecosystem, this process changes from a manual historical investigation into an automated, real-time diagnostic workflow.
Traditional RCA vs. AI-Driven RCA
Traditional root cause analysis is historical and manual. When a failure happens, engineers look backward at graphs, query log systems using static search parameters, and piece together a timeline. It relies heavily on human intuition and tribal knowledge.
AI-driven root cause analysis is real-time, continuous, and algorithmic. Instead of waiting for a human to start an investigation, an AIOps platform continuously ingests performance data, builds mathematical baselines of normal behavior, tracks dependencies across systems, and instantly points to the specific component that triggered the chain reaction.
| Aspect | Traditional RCA | AI-Driven RCA |
| Speed | Hours to days of manual log sorting | Near real-time identification |
| Data Scope | Restricted to human-selected logs and metrics | Whole-system ingestion of metrics, logs, and traces |
| Analysis Method | Human-driven timeline stitching | Algorithmic event correlation and topology mapping |
| Nature | Purely reactive after a crash occurs | Proactive, highlighting anomalies before failure |
The Demands of Modern Infrastructure
Modern software architectures run on thousands of ephemeral cloud containers, managed databases, third-party APIs, and serverless computing modules. If a single microservice suffers from a slight memory leak, it can cause a database queue to back up, which then starves a web gateway of connection threads, ultimately showing a generic error page to the end user.
To a human operator looking at standard monitoring charts, it looks like four different systems broke at the exact same moment. An intelligent system looks at the underlying relationship map, analyzes the timestamps down to the millisecond, and recognizes that the microservice memory leak was the actual root cause, while the other failures were simply downstream symptoms.
The Triad: AIOps, Observability, and RCA
Automated troubleshooting relies on three deeply connected concepts:
- Observability: The practice of collecting deep internal state data from an infrastructure using three core pillars: metrics (numerical values over time), logs (textual records of discrete events), and traces (the end-to-end journey of a request through different systems).
- AIOps: The intelligent engine that sits on top of this observability data. It uses machine learning algorithms to sort through the massive volume of data, filtering out noise and finding patterns.
- Root Cause Analysis (RCA): The ultimate output of the system. The observability platform provides the raw clues, the AIOps platform acts as the detective that connects the dots, and the RCA report is the final answer that explains exactly what went wrong and how to fix it.
Why Root Cause Analysis Matters in Modern IT Operations
Enterprise IT operations cannot scale by simply hiring more people to look at screens. When an online banking system or an e-commerce checkout page slows down, businesses lose thousands of dollars per second. Implementing intelligent analysis provides a series of direct operational upgrades.
Faster Incident Resolution and Reduced Downtime
The ultimate goal of any production support team is to minimize mean time to resolution, or MTTR. MTTR is broken down into time to detect, time to identify, and time to fix. Traditional operations spend nearly 80% of an incident timeline just trying to isolate where the problem lives. By automating the identification step, AIOps drops the time to identify from hours to seconds, allowing engineers to jump directly to applying the fix.
Intelligent Alert Management and Noise Reduction
A common problem in enterprise command centers is alert fatigue. When hundreds of daily alerts fire for non-critical issues, engineers become numb to them. When a real, critical failure happens, it gets missed because it is buried under thousands of minor notifications. AIOps algorithms group these related alerts into single, unified incident contexts. Instead of sending fifty separate emails about high CPU usage across fifty connected servers, the system sends one single alert stating that an underlying storage array has failed, causing latency across the cluster.
Cloud-Scale Monitoring Challenges
In a traditional data center, servers were static and long-lived. You knew exactly which database ran on which rack. In a modern cloud-native environment, Kubernetes clusters automatically spin up and destroy application instances based on real-time traffic demands. Human operators cannot draw static architecture maps for systems that shift dynamically throughout the day. Intelligent analysis tools continuously discover these systems automatically, mapping dependencies on the fly so that when a failure occurs, the system knows exactly how the components were connected at that specific second.
Core Concepts of AIOps-Driven RCA
To understand how an intelligent system performs root cause analysis, we must break down the core components and mathematical concepts that run under the hood of an AIOps platform.
Event Correlation
Event correlation is the process of grouping distinct alerts and events together based on shared characteristics like time, topology, and context. If a database throws a connection error at 10:05 AM, and an application server throws a timeout error at 10:05 AM, an event correlation engine analyzes the network path between them and bundles them into a single incident. This prevents the system from triggering multiple redundant troubleshooting tickets for the same underlying issue.
Anomaly Detection
Traditional monitoring systems rely on static thresholds. For example, you might set a rule that sends an alert if a server’s memory usage goes over 90%. However, if a data-processing server safely operates at 95% usage every Wednesday night during a planned batch job, a static threshold will send a false alarm every week.
Anomaly detection uses machine learning to look at historical data and calculate a dynamic baseline. It understands what normal looks like for specific days and hours. If memory usage jumps to 85% on a Sunday morning when traffic is usually minimal, the system flags it as an anomaly, even though it never crossed the old 90% static threshold.
Machine Learning in IT Operations
AIOps uses both supervised and unsupervised machine learning algorithms. Supervised algorithms learn from historical ticket logs. If the system reads past incident tickets and sees that a certain pattern of log errors was labeled as a “database disk failure” by human engineers fifty times in the past, it learns to recognize that pattern automatically. Unsupervised algorithms require no historical labeling; they simply scan incoming data streams to find outliers, clusters, and unusual shifts in system performance.
Predictive Monitoring
Predictive monitoring shifts an enterprise from reacting to failures to stopping them before they happen. By analyzing trends in metric degradation, such as a steady, linear drop in available storage space or a gradual rise in API response latency, machine learning models can forecast exactly when a system will run out of resources or breach an agreement threshold. This gives operations teams hours of advance notice to provision more hardware or clear out system caches before users experience an actual slowdown.
Observability
As mentioned earlier, observability is the continuous ingestion and understanding of internal states via telemetry data. True AIOps platforms require deep observability rather than simple monitoring. While monitoring tells you when a system is broken, observability provides the rich, deep data tracks required to understand why it broke.
Log Analytics
System logs are the diary of an application. When an error occurs, the code writes an explicit message to a log file detailing exactly what failed. At enterprise scale, applications generate terabytes of log data every hour.
AIOps log analytics tools use natural language processing (NLP) to read, categorize, and structure these massive streams of text. The algorithm automatically filters out repetitive “info” logs, groups similar error statements together, and identifies rare log entries that have never appeared in the system before. These rare entries are frequently the smoking gun of a major architectural failure.
Incident Intelligence
Incident intelligence combines technical infrastructure data with human business context. It looks at which applications are currently failing and checks them against business impact parameters. For example, an incident affecting the payment processing backend of a major enterprise is instantly escalated to top priority, while a failure in a non-production testing environment is assigned a lower priority level, ensuring that engineering teams focus their energy where it matters most for the business.
Automated Troubleshooting
Once an anomaly is flagged, the AIOps engine executes automated diagnostic playbooks. For example, if a web service begins failing, the system does not just report the failure; it automatically runs background network diagnostics, pings the dependent databases, checks recent code deployment logs, and compiles these test results directly into the incident ticket. This saves the human engineer from performing the initial baseline diagnostic steps manually.
Alert Noise Reduction
By grouping related alerts, suppressing non-actionable warnings, and ignoring expected performance spikes during maintenance windows, AIOps systems routinely eliminate up to 90% of raw alert noise. This drastic reduction ensures that the operations team remains focused, sharp, and responsive when a critical notification arrives.
Self-Healing Systems
The highest level of maturity in AIOps-driven operations is the self-healing system. When a root cause is identified with a high level of mathematical confidence, the AIOps platform can trigger automated remediation workflows to fix the problem without human intervention.
If the system detects that a specific application process has suffered a terminal dead-lock, it can issue an automated command to restart that specific microservices container, clear the active connection pool, and verify that health metrics have returned to baseline, logging the entire sequence for the engineering team to review later.
AIOps RCA Architecture & Workflow
To build a reliable enterprise operation, you need to understand how data moves from a raw server all the way through to an automated resolution. The architecture of a modern AIOps root cause analysis system is built as a sequential data pipeline.
1. The Monitoring Pipeline and Collection Systems
The foundational layer consists of lightweight open-source and proprietary collection agents installed across the entire infrastructure. These agents gather data from physical servers, cloud platforms, network switches, and application runtimes.
- Metrics Collection: Collects numerical data points at regular time intervals, tracking parameters like CPU utilization, RAM consumption, disk input/output operations, and network bandwidth usage.
- Log Collection Systems: Agents continuously tail system log files, wrapping each log line in a standardized format with a precise timestamp, host identification, and severity tag before streaming them to a central repository.
- Traces Ingestion: Application performance monitoring tools inject unique tracking IDs into network requests. As a request travels from a user’s browser, through web gateways, into various microservices, and down to a database, this trace ID records the exact latency contributed by each step.
2. The AI/ML Analysis Engine
Once the streaming pipeline delivers this massive volume of raw telemetry data to the central platform, the AI engine takes over. The engine organizes the data along three primary dimensions:
- Temporal Analysis (Time): The system aligns all metrics, logs, and traces onto a unified master timeline, looking for events that occurred within the exact same microsecond window.
- Topological Analysis (Space): The platform maps out the structural relationships between systems. It learns which virtual machine depends on which storage unit, and which microservice calls which database.
- Contextual Analysis (Meaning): Using natural language processing and historical pattern matching, the engine evaluates the semantic content of error logs and system warnings to classify the nature of the issue.
3. Event Intelligence and Incident Prioritization
The platform filters out thousands of standard monitoring notifications and clusters the remaining anomalies into a single operational incident. The system assigns a clear priority score based on how many customer-facing services are impacted and how deeply the infrastructure is degraded.
4. Automated Remediation Systems
Once the root cause is isolated, the platform communicates with internal management tools to generate an incident ticket complete with the full timeline and identified root cause. Simultaneously, if a pre-approved fix exists for that specific failure mode, the engine calls automated execution tools to run a remediation playbook, restoring the system to a healthy state.
Root Cause Analysis Lifecycle in AIOps
The journey from a raw infrastructure anomaly to a permanently resolved problem follows a structured lifecycle. The table below outlines how an AIOps system automates each phase of this journey.
| Stage | Purpose | Technologies Used | Real-World Outcome |
| Data Collection | Gathering all infrastructure telemetry data without dropping records. | Prometheus, OpenTelemetry, Fluentd | A complete, uncompressed stream of all enterprise metrics, logs, and traces. |
| Monitoring | Watching for live status changes and verifying basic system health. | Grafana, Datadog agents, Nagios | Continuous visibility into basic performance indicators across the cloud environment. |
| Event Aggregation | Cleaning, filtering, and centralizing thousands of notifications. | Apache Kafka, Logstash, Vector | Elimination of redundant alerts and a clean, structured repository of system events. |
| Pattern Analysis | Finding historical trends and building normal system baselines. | Linear Regression, K-Means Clustering | Deep knowledge of how the application behaves across different days and traffic loads. |
| Anomaly Detection | Highlighting unusual behavior that deviates from normal baselines. | Isolation Forests, LSTM Neural Networks | Instant detection of silent failures or resource leaks before they trigger a major crash. |
| Root Cause Identification | Tracking down the single underlying fault that started the failure. | Dependency Tree Mapping, Causal Graph Analysis | A single, actionable alert that points straight to the specific component that broke. |
| Automated Response | Fixing the issue immediately or providing clear guidance to on-call teams. | Ansible, Kubernetes Operators, Runbooks | Drastic reduction in system downtime, often resolving the issue within seconds. |
| Continuous Optimization | Reviewing post-incident data to update and improve ML baselines. | Feedback loops, Post-Mortem analytics | An increasingly smart automation platform that prevents future instances of the same error. |
Popular AIOps & Observability Tools
The AIOps marketplace includes various platforms that cater to different aspects of infrastructure visibility and intelligent automation. To build an effective enterprise monitoring platform, organizations mix and match tools from several core categories.
Tool Categories
- Monitoring Tools: These focus on tracking real-time metrics and overall system health. They excel at displaying large quantities of time-series data.
- Log Analytics Platforms: Designed to ingest, index, and search through massive quantities of text data generated by applications and operating systems.
- Observability Platforms: Modern solutions that natively combine metrics, logs, and traces into a single unified workspace, providing deep context.
- Incident Management Tools: The human coordination layer. These platforms handle on-call schedules, alert routing, and incident collaboration.
- AI-Driven Automation Platforms: Dedicated engines focused specifically on ingesting multi-source data to perform event correlation and automated remediation.
- Cloud Monitoring Systems: Native monitoring tools provided directly by cloud vendors to track resources inside their specific environments.
Tool Comparison Matrix
| Tool | Purpose | Difficulty | Enterprise Usage |
| Dynatrace | Full-stack Observability and AI-driven RCA | Medium to High | Extensively used in large enterprises, banking, and complex hybrid-cloud systems. |
| Datadog | Unified Metrics, Logs, and Traces Platform | Medium | Highly popular with SaaS companies, cloud-native startups, and modern DevOps teams. |
| Splunk Enterprise | Advanced Deep Log Analytics and Security Operations | High | The standard choice for large corporations requiring deep security, compliance, and log searching. |
| Prometheus & Grafana | Open-source Metrics Collection and Visualization | Medium | The industry standard for Kubernetes tracking, cloud-native infrastructure, and DevOps labs. |
| PagerDuty | Incident Orchestration and Smart Event Clustering | Low to Medium | Used universally to route alerts to on-call teams and coordinate incident bridges. |
| BigPanda | Independent AIOps Event Correlation Engine | Medium | Implemented by massive enterprises to unify alerts from multiple distinct monitoring tools. |
| AWS CloudWatch | Native Amazon Web Services Resource Monitoring | Low to Medium | Used by default by any organization running workloads inside the AWS cloud ecosystem. |
Real-World Use Cases of AIOps RCA
To appreciate the impact of Root Cause Analysis with AIOps, let us explore how these systems operate inside actual enterprise production environments.
Cloud Infrastructure
In a multi-region cloud deployment, a network configuration error inside a single virtual private cloud (VPC) can block communication between an application layer and its backend. Instead of forcing cloud engineers to manually check routing tables across multiple cloud accounts, an AIOps system analyzes network path data, isolates the specific security group change that caused the blockage, and flags the exact automated deployment script that introduced the error.
Kubernetes Environments
Kubernetes clusters use microservices that scale up, down, and move across physical servers constantly. If an application pod experiences a “CrashLoopBackOff” error due to an incorrect configuration value, it can trigger upstream errors in web traffic gateways. An AIOps platform reads the live container lifecycle events, correlates them with the application error logs, and tells the SRE team exactly which deployment file contains the invalid parameter.
Banking Systems
Financial networks handle millions of transactional messages through strict legacy pipelines and modern APIs. A sudden slowdown in transaction processing can back up payment processing lines, threatening compliance penalties.
An intelligent operations platform can trace an individual transaction down to a locked database row in a legacy database system, alerting the database administrators to kill the blocking query before it impacts thousands of customer debit card attempts.
Telecom Operations
Telecommunications providers manage massive networks of physical cell towers, routers, and fiber optic lines. When an underwater fiber cable is damaged, thousands of automated network alarms fire simultaneously across the country. An AIOps platform uses a physical topology map of the network to instantly recognize that all the failing towers route through that single fiber line, allowing field engineers to navigate directly to the physical break point.
Healthcare IT Systems
In hospital networks, electronic health record (EHR) systems must remain online around the clock. If an authentication server slows down, doctors cannot access patient charts quickly.
An AIOps engine detects the slight latency increase in the authentication module, traces the root cause to an expired security certificate on an internal load balancer, and automatically alerts the security infrastructure team with instructions on how to renew the certificate.
SaaS Platforms
Software-as-a-Service applications run multi-tenant setups where thousands of corporate customers share underlying hardware resources. If a single customer runs an unoptimized database query that consumes all available disk performance, all other customers on that database instance experience severe lag.
An intelligent log and metric analyzer isolates the specific tenant ID running the heavy query, separates their traffic into a temporary sandbox container, and keeps the platform running smoothly for everyone else.
E-Commerce Applications
During major online holiday shopping events, e-commerce applications experience massive spikes in traffic. If a payment checkout page fails, customers will abandon their carts and shop elsewhere.
Predictive monitoring tracking checkout workflows can detect when an payment gateway API starts throwing intermittent errors. The system can automatically route new checkouts through an alternative backup payment processor, preserving revenue while engineers fix the primary gateway.
Enterprise Monitoring Systems
Large enterprises often use multiple monitoring tools across different departments (e.g., SolarWinds for networking, AppDynamics for applications). This creates data silos.
A central AIOps layer ingests data from all these separate platforms, acting as a single pane of glass. When a cross-department infrastructure failure occurs, the central engine correlates the network data with the application data, breaking down organizational silos and helping different teams work together effectively.
Benefits of AI-Driven Root Cause Analysis
Implementing an intelligent, automated root cause analysis workflow yields massive improvements across both technical performance and business sustainability metrics.
- Faster MTTR (Mean Time to Resolution): By turning hours of manual log digging into seconds of automated pattern recognition, the overall duration of system outages drops significantly, keeping services online.
- Reduced Alert Fatigue: Filtering out thousands of non-actionable alerts lets engineers keep their focus where it belongs. Teams remain sharp, calm, and ready to act when real incidents arise.
- Better Incident Prioritization: Machine learning models look past generic system warnings to evaluate actual business impact. Teams are guided to fix revenue-critical applications before attending to minor internal issues.
- Proactive Issue Detection: Predictive monitoring spots resource depletion trends and subtle performance anomalies early. This allows teams to apply fixes during regular working hours before a system breaks completely.
- Reduced Operational Costs: Minimizing major downtime events saves companies from costly SLA penalties, lost consumer revenue, and the need to pay teams excessive emergency overtime.
- Automation Efficiency: Automating initial data gathering and triage workflows frees senior engineers from repetitive manual checks, giving them more time to build reliable new features.
Challenges & Limitations
While Root Cause Analysis with AIOps offers incredible power, establishing these platforms in large systems comes with its own set of real-world challenges.
Data Quality Issues and “Garbage In, Garbage Out”
Machine learning models are only as good as the data you feed them. If an enterprise has broken logging standards, missing time synchronization protocols across servers, or unmonitored infrastructure areas, the AIOps engine will analyze incomplete data and output inaccurate conclusions.
AI Model Complexity and the “Black Box” Problem
Some advanced machine learning algorithms can isolate an anomaly but fail to explain why they flagged it. If an operational tool says “This system is failing with 98% confidence” but cannot show its work, engineers will find it difficult to trust the tool’s recommendations during a major production emergency.
False Positives and Tuning Overhead
An over-sensitive anomaly detection model can flag completely safe variations in system behavior as critical threats. If an AIOps system sends constant false alarms, engineers will learn to ignore it, recreating the exact alert fatigue problem the tool was bought to solve.
Practical Solutions
- Enforce Global Logging Standards: Before launching an AI engine, use open-source collection standards like OpenTelemetry across all engineering groups to ensure clean, consistent data formats.
- Implement Step-by-Step Automation: Do not move immediately to fully automated self-healing systems. Start by using AIOps to provide recommendations to human engineers. Once the tool proves its accuracy over several months, you can safely turn on automated remediation for those specific issues.
- Commit to Continuous Baseline Tuning: Assign dedicated engineering time to regularly review and adjust your monitoring baselines, making sure the machine learning models adapt as your software evolved over time.
AIOps & Observability Career Opportunities
The massive corporate shift toward intelligent automation has created a severe shortage of skilled professionals who understand both system operations and intelligent data analytics. This represents a prime career upgrade window for technology professionals.
Key Roles
- AIOps Engineer: A specialist focused on deploying, tuning, and maintaining the machine learning platforms that watch over corporate infrastructure. They bridge the gap between data science and traditional systems engineering.
- Observability Engineer: An expert dedicated to building the data pipelines, metric collectors, and tracing frameworks that make complex software systems fully visible and easy to analyze.
- Site Reliability Engineer (SRE): An engineer who applies software engineering principles to operations tasks. They use automated systems and AIOps tools to build highly reliable, scalable infrastructure.
- Automation Architect: A senior technical leader who designs self-healing workflows, automated playbooks, and systems integration pathways to reduce manual human intervention.
Required Skill Set
To build a successful career in this modern operational ecosystem, engineers need a balanced blend of traditional administration and modern cloud automation skills:
- Deep comfort working inside Linux environments and cloud infrastructure networks.
- Mastery of modern open-source tracking tools like Prometheus, Grafana, and OpenTelemetry.
- Practical programming skills in Python or Go to write data scripts and build automated solutions.
- A strong grasp of DevOps methodologies, continuous integration/continuous deployment (CI/CD) systems, and infrastructure-as-code tools like Terraform.
Salary Trends and Market Demand
Because intelligent infrastructure stability directly protects company profits, enterprises are willing to pay top salaries for engineering talent in this space. Globally, experienced Observability and Site Reliability Engineers regularly earn premium salaries compared to standard system administrators, with demand growing across sectors like banking, healthcare, retail, and enterprise software.
Beginner Roadmap for Learning AIOps RCA
If you are new to this field, trying to learn everything at once can feel overwhelming. The key to success is to build your knowledge in a logical, step-by-step sequence.
Phase 1: Establish the Foundations
Before playing with advanced AI tools, you must understand the underlying systems they monitor. Spend time learning your way around the Linux command line, understanding file structures, and learning how to read basic system resources. Master core networking concepts like TCP/IP, DNS routing, and HTTP status codes, as these form the foundational language of system failures.
Phase 2: Learn Modern Observability
Move away from static health checks and master the world of telemetry data. Learn how to install Prometheus to collect system metrics, and practice building clean dashboards in Grafana. Experiment with log collectors like Fluentd to centralize text records, and learn how distributed tracing follows a user request through a multi-tier application.
Phase 3: Embrace Scripting and Automation
An automated operations career requires programming skills. Learn Python basics, focusing on how to read log files, parse text data, and interact with external systems via web APIs. Explore basic automation tools like Ansible to learn how to write simple scripts that can automatically restart services or clear out full disk drives when triggered.
Practical Practice Projects
- Build a Local Monitoring Lab: Set up a free virtual server on a cloud provider or your personal machine. Install Prometheus and Grafana, and write a simple script that intentionally stresses the server’s CPU to watch how your dashboards react in real-time.
- Construct a Log Analyzer: Write a small Python script that reads a sample application log file, uses text filtering to search for words like “ERROR” or “CRITICAL”, and prints out a summary detailing exactly how many errors occurred and when they happened.
- Deploy a Sample Microservice Application: Use open-source microservices sample applications on a local machine. Inject basic tracing tools to map out how requests move through the system, then intentionally shut down one sub-service to see how the failure impacts the rest of the application network.
Certifications & Training
Earning an industry certification is an excellent way to validate your skills, stand out to corporate recruiters, and structure your learning process. The matrix below highlights key certification programs across various experience levels.
| Certification | Level | Best For | Skills Covered |
| Certified Kubernetes Administrator (CKA) | Intermediate | Aspiring SREs, DevOps engineers, and cloud administrators. | Core Kubernetes architecture, scheduling, container networking, and cluster troubleshooting. |
| Dynatrace Certified Associate | Intermediate | Enterprise engineers using dedicated enterprise AIOps tools. | Full-stack performance tracking, automated anomaly analysis, and platform path tracing. |
| Datadog Fundamentals Certification | Beginner | Engineers looking for modern, cloud-native visibility. | Core metrics monitoring, log parsing, application tracing, and smart alert setup. |
| Splunk Core Certified Power User | Intermediate | Security specialists and deep enterprise log analysts. | Complex log searching, data transformation, dashboard building, and macro analytics. |
Common Beginner Mistakes
When starting out in this space, it is easy to fall into common traps that slow down your learning and lead to poor implementation choices.
- Focusing Only on Tools While Ignoring Basics: Many beginners spend weeks learning the complex interface of a premium monitoring platform without understanding the underlying Linux commands or networking paths. If you do not know how a web server handles connection queues, an AI tool’s dashboard won’t help you fix a performance bottleneck.
- Treating Every Performance Metric as a Critical Alert: New engineers often configure their systems to send notifications for minor performance variations. This immediately creates alert fatigue, causing teams to ignore their dashboards completely.
- Skipping Observability and Relying on Basic Uptime Checks: Assuming a system is perfectly healthy just because a ping test shows it is online is a classic mistake. Real reliability requires deep visibility into application metrics and request latencies.
- Overcomplicating Solutions with Machine Learning: Do not try to use complex neural networks to solve simple problems that can be addressed with a straightforward alert rule. Use basic automation first, reserving advanced AI algorithms for high-volume data streams and complex correlation tasks.
Best Practices for AIOps RCA
To achieve maximum stability and value from an automated root cause analysis implementation, follow these core operational principles:
- Adopt an Observability-First Mindset: Design your software systems to share deep telemetry data from day one. Do not treat logging and tracing as an afterthought to be added after an outage occurs.
- Prioritize Alert Grouping over Alert Volume: Focus on configuring your platform to group related alerts into unified incidents based on time and system dependencies, shielding your on-call teams from unnecessary noise.
- Build Thorough System Architecture Maps: Keep your system dependency documentation clear and up to date. Many AIOps engines rely on these topological relationship maps to run their correlation algorithms accurately.
- Enforce Strong Post-Incident Reviews: Every time a major outage occurs, hold a structured review meeting. Use the data gathered by your AIOps platform to understand the timeline, and use those insights to refine your automated response playbooks.
- Ensure Monitoring Is Security-Aware: Secure your telemetry data streams. System logs often contain sensitive customer data or internal infrastructure secrets; make sure this data is encrypted and access-controlled.
Future of Root Cause Analysis with AIOps
The field of intelligent infrastructure operations is evolving rapidly. As systems continue to scale, several major trends are shaping the future of enterprise operations.
Generative AI and Interactive Operations Copilots
The integration of natural language generative models is changing how engineers interact with infrastructure. Instead of writing complex data queries during an outage, engineers can simply ask their platform conversational questions, like “What changed in our payment system over the last hour?” The system can instantly compile a text summary of recent code deployments, configuration shifts, and anomalies, serving as an intelligent operations assistant.
Autonomous Incident Management and Hyperautomation
We are moving beyond basic alert routing toward systems that handle incidents entirely on their own. Future enterprise infrastructures will use closed-loop automation networks. These networks will independently detect anomalies, run deep diagnostic tests, isolate root causes, execute remediation playbooks, and verify health recoveries without requiring a human operator to click a button.
Predictive Cloud Optimization and Self-Optimizing Fabrics
Future AI operations engines won’t just step in when things break. They will continuously study workload patterns to adjust infrastructure size and shape in real time. The system will proactively move data workloads across cloud regions, scale down quiet infrastructure areas to minimize energy costs, and reconfigure network paths to guarantee a flawless user experience before any slowdown can occur.
FAQs
1. What is root cause analysis in AIOps?
Root cause analysis in AIOps is the practice of using machine learning algorithms and automated data correlation to instantly identify the underlying technical fault that triggered an IT incident, removing the need for manual log analysis.
2. How does AIOps reduce corporate system downtime?
AIOps reduces downtime by automating the discovery and triage phases of an incident. It pinpoints the exact point of failure within seconds, allowing engineers to jump straight to fixing the issue rather than spending hours trying to find it.
3. What is event correlation and why is it important?
Event correlation is an algorithmic process that groups separate system alerts together based on time, location, and structural dependencies. It is important because it condenses hundreds of individual error notifications into a single, actionable incident ticket.
4. Is machine learning absolutely necessary for effective AIOps?
Yes, machine learning is essential because modern enterprise systems generate data volumes far too massive for human teams to parse manually. Algorithms are required to calculate dynamic performance baselines, spot subtle anomalies, and find hidden patterns across separate data streams.
5. Which tools are most commonly used for system observability?
The most common tools include comprehensive platforms like Dynatrace and Datadog, advanced log analytics platforms like Splunk, and popular open-source software combinations like Prometheus and Grafana.
6. Can a beginner learn and build a career in AIOps?
Yes, beginners can absolutely enter this field. However, you should focus on learning core infrastructure fundamentals first—like Linux administration, basic networking, and traditional logging—before moving on to advanced machine learning platforms.
7. Is coding or scripting required to work in the AIOps space?
Yes, a basic level of scripting knowledge is highly valuable. Engineers regularly use languages like Python or Go to connect separate systems, extract telemetry data from APIs, and write automated remediation playbooks.
8. What industries benefit most from implementing AIOps RCA?
Any industry that relies on continuous digital availability benefits from AIOps. It is heavily utilized within online banking, e-commerce, cloud software platforms, telecommunications networks, and digital healthcare applications.
9. What is the difference between standard monitoring and observability?
Standard monitoring tracks whether a system is online or offline by measuring external indicators. Observability collects deep internal data streams—metrics, logs, and traces—allowing teams to understand exactly why a complex system is behaving poorly.
10. What is alert fatigue and how does automation solve it?
Alert fatigue occurs when engineering teams are flooded with thousands of minor, non-actionable notification emails every day, causing them to become numb and miss real problems. AIOps solves this by filtering out noise and grouping related warnings into a single alert.
11. Can an AIOps platform fix system failures automatically?
Yes, through automated remediation workflows. When the AI identifies a root cause with high mathematical confidence, it can trigger automated systems to run pre-approved scripts, such as restarting a failed service or clearing a full storage drive.
12. What are the main limitations when implementing AIOps?
The main limitations include poor baseline data quality across legacy applications, the high initial cost of premium platform licensing, and the challenge of tuning models to avoid sending excessive false alarms.
13. How does predictive monitoring differ from traditional alert systems?
Traditional alert systems only trigger after a metric breaches a fixed boundary line, meaning the system is already broken. Predictive monitoring analyzes live consumption trends to forecast exactly when a failure will happen, giving teams hours to prevent it.
14. What skills should I focus on to become an SRE or AIOps specialist?
Focus on mastering Linux system foundations, cloud platforms like AWS or Azure, container orchestration through Kubernetes, open-source metrics tracking with Prometheus, and basic automation scripting using Python.
15. How are generative AI models changing root cause analysis?
Generative AI allows engineers to interact with their system dashboards using standard conversational language. It can automatically read thousands of log lines during an emergency and generate a clear text summary explaining what went wrong and how to fix it.
Final Thoughts
As corporate software systems continue to expand into complex, distributed cloud architectures, old-school manual infrastructure troubleshooting is no longer viable. The future of software reliability belongs to automated intelligence. This shift is why fields like deep system observability and automated operations are experiencing such explosive growth worldwide.
If you are a technology student or an IT professional looking to safeguard your career, do not get caught simply memorizing the buttons of one specific software platform. Focus on mastering the core principles of system behavior, understanding data flow, and adopting a proactive automation mindset. Learn how to look at a sprawling system of microservices and trace how an issue in one area impacts another.
