Upgrade & Secure Your Future with DevOps, SRE, DevSecOps, MLOps!
We spend hours scrolling social media and waste money on things we forget, but won’t spend 30 minutes a day earning certifications that can change our lives.
Master in DevOps, SRE, DevSecOps & MLOps by DevOps School!
Learn from Guru Rajesh Kumar and double your salary in just one year.
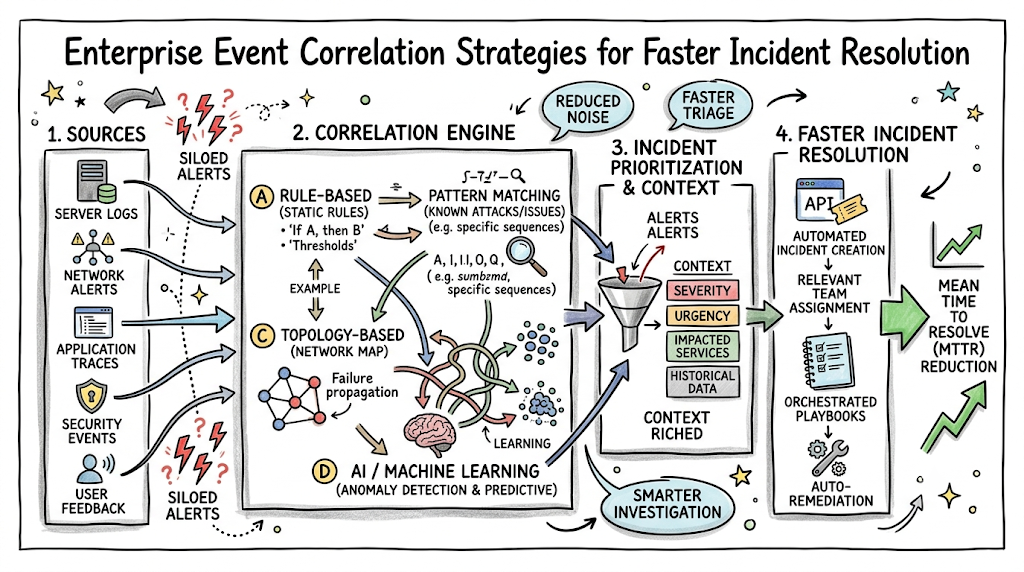
In simple terms, event correlation is the process of connecting the dots between separate data points across your infrastructure. Instead of viewing every notification as an isolated issue, an intelligent system analyzes relationships, timings, and topologies to find common threads. It bundles thousands of scattered notifications into a single, cohesive, and actionable incident narrative. This approach is critical for modern IT operations because infrastructure complexity has outgrown manual human analysis. Without a way to group and understand these signals, engineers suffer from severe alert fatigue, and system downtime increases. Organizations cannot maintain high availability when operations teams spend hours simply sorting through duplicate notifications. In this article, you will learn how event correlation transforms chaotic infrastructure data into clear, actionable operational intelligence. We will break down the core principles, look at real-world scenarios, and explore how modern analytics can optimize your workflow. To deepen your understanding of these concepts and explore practical operational learning materials, check out the educational guides available at TheAIOps.
The Origin of Event Correlation in IT Operations
The Challenge of Traditional Monitoring Systems
Years ago, IT environments were predictable, static, and relatively easy to track. Every application ran on a dedicated physical server, and infrastructure teams knew exactly which wire connected to which port. When something failed, a single alert usually pointed directly to the broken hardware component.
As enterprises adopted virtualization and multi-tier architectures, this predictable world vanished. Traditional monitoring tools were designed to watch single metrics, like CPU utilization or disk space, in isolation. They lacked the context to understand how a failure on one server impacted a database running elsewhere.
This gap created massive operational inefficiencies and widespread alert overload. A single database hiccup would trigger secondary alarms across web servers, load balancers, and application performance monitoring tools. Operations teams found themselves drowning in repetitive notifications, unable to distinguish a minor warning from a catastrophic failure.
The Rise of Centralized Monitoring Platforms
To combat this fragmentation, organizations began deploying centralized monitoring platforms to collect data under one roof. These platforms gathered logs, metrics, and traces from different silos, attempting to provide a single pane of glass. This evolution marked a significant step forward for enterprise observability tools.
Instead of logging into five different dashboards, an engineer could view network, system, and database performance in one place. This centralized visibility made it easier to see that multiple systems were failing at the same time. However, simply gathering all the alarms into one bucket did not solve the underlying noise problem.
The data was now in one location, but the responsibility for connecting the pieces still fell on human operators. Engineers had to manually build complex dashboards and cross-reference timestamps to understand how failures correlated. The volume of data increased faster than the human capacity to interpret it.
The Emergence of Intelligent Event Correlation
As infrastructure expanded into dynamic cloud environments, manual cross-referencing became completely unfeasible. Microservices and containers launched and destroyed themselves in minutes, leaving traditional static analysis useless. Organizations needed a way to move from raw alerts to actionable insights without human intervention.
This necessity drove the development of intelligent event correlation systems. Instead of relying on rigid, hardcoded logic, these platforms started analyzing behavioral patterns and system topologies. They could automatically recognize that a sudden drop in database response times caused the subsequent errors on the frontend.
This shift transformed IT operations from a reactive guessing game into a precise, data-driven science. Teams no longer wasted the first hour of an incident figuring out who should ownership of the problem. Intelligent correlation gave them the exact context needed to start fixing the issue immediately.
Defining Event Correlation in Modern IT Systems
The Core Concept Behind Event Correlation
At its heart, event correlation is about shifting focus from individual symptoms to the overarching problem. In simple terms, it takes a high volume of messy system notifications and groups them into a small number of meaningful incidents. It acts as an intelligent filter between your raw infrastructure telemetry and your engineering team.
Consider a simple enterprise example: an underlying storage array experiences a sudden hardware fault. This single failure causes database queries to time out, which causes the application layer to drop user requests, which ultimately causes the external payment gateway to fail.
A standard monitoring setup will generate unique, high-priority alerts for every single one of those steps. An event correlation engine recognizes that all these notifications occurred within seconds of each other and share underlying infrastructure pathways. It groups them together, alerting the on-call engineer to the storage fault while listing the application timeouts as secondary symptoms.
Daily Operational Use Cases
This process becomes critical when managing large-scale environments where thousands of changes occur every hour. Let’s look at how this plays out in daily operations.
- Flapping Alerts: A server network interface card goes up and down repeatedly, generating hundreds of notifications in ten minutes. Correlation engines collapse these into a single “interface flapping” incident.
- Code Deployments: A new microservice version is pushed to production, immediately followed by a spike in error rates across three downstream services. The system links the deployment event directly to the service degradation.
- Database Deadlocks: A locked database table causes thread exhaustion across multiple independent application containers. Correlation groups the container alerts under the core database event.
Event Correlation vs. Alert Management
It is easy to confuse event correlation with basic alert management, but they serve different purposes. Alert management is primarily concerned with handling notifications after they are generated. It deals with routing alerts to the right person, managing on-call schedules, and tracking acknowledgment times.
Event correlation, on the other hand, happens before an incident ticket is ever opened. It acts upon raw data streams to analyze, filter, and contextualize information. Alert management routes the message, but event correlation decides what the message should actually say.
| Feature | Alert Management | Event Correlation |
| Primary Focus | Notification routing and on-call workflows | Data analysis, pattern matching, and grouping |
| Input Data | Standardized alerts and tickets | Raw logs, metrics, events, and topologies |
| Operation Level | Process and human workflow level | Technical data and system intelligence level |
The Operational Intelligence Mindset
Adopting event correlation requires a shift in how your team views system health. Moving away from a checklist of individual server metrics forces teams to embrace an operational intelligence mindset. Success is no longer measured by how many alerts you cleared, but by how quickly you understood the system’s state.
This mindset focuses on proactive incident detection and faster resolution times. When engineers trust that their system will automatically isolate the root cause, they stop hovering over dashboards. They can focus on building resilient infrastructure, knowing that correlation engines will give them clear direction when anomalies occur.
The 7 Core Principles of Event Correlation
1. Alert Aggregation
The first step in making sense of infrastructure data is gathering it into a single stream. Alert aggregation involves collecting and consolidating related alerts from every corner of your enterprise stack. This includes network logs, application performance data, cloud metrics, and security notifications.
Without effective aggregation, data remains trapped inside isolated team silos. The network team looks at their tools, the developers look at theirs, and no one sees the full picture. Aggregation breaks down these walls, creating a unified data layer where cross-system patterns can be discovered.
2. Noise Reduction
Once data is aggregated, the immediate priority is filtering out the junk. Noise reduction focuses on lowering alert fatigue for operations teams by removing duplicates and non-actionable warnings. If a server sends fifty identical notifications about a temporary CPU spike, the system compresses them into one.
Reducing this background noise ensures that critical alerts are never missed. When engineers are bombarded with hundreds of low-priority notifications, they eventually start ignoring their monitoring dashboards. Effective noise reduction cleans up the workspace so teams can see what truly matters.
3. Pattern Recognition
Systems do not fail randomly; they usually follow distinct sequences of behavior during a breakdown. Pattern recognition involves identifying recurring operational issues by analyzing historical event data. The correlation engine looks for common sequences, asset combinations, or timing intervals that match past outages.
For example, if a memory leak always precedes a specific service crash, the system learns to spot that pattern early. Recognizing these signatures allows the platform to catch impending issues before they escalate into user-facing downtime.
4. Root Cause Analysis Support
When an incident occurs, fixing the symptom provides temporary relief, but finding the source prevents future occurrences. Event correlation supports root cause analysis by linking disparate operational symptoms back to their underlying causes.
By analyzing the order of events and system dependencies, the engine points engineers toward the origin of the failure. If a switch fails, the system points to the switch rather than the fifty virtual machines that lost connectivity because of it.
5. Context Enrichment
A raw error code like “Status 500” tells an engineer very little on its own. Context enrichment solves this by adding infrastructure, application, and business context to incoming events. The correlation engine automatically decorates raw alerts with extra metadata.
[Raw Alert] -> [Correlation Engine] -> [Enriched Incident]
- Error 500     - Pulls CMDB Data       - Error 500 on Payment Service
                - Checks Latest Git Commit  - Impacts: Premium Users
                - Finds Affected Region     - Caused by: Commit #9281 (Region: US-East)
This enrichment allows the responder to understand the true impact and location of the problem without manually searching through configuration management databases.
6. Automated Incident Creation
Once a group of events has been aggregated, cleaned, and enriched, it needs to be assigned to a human worker. Automated incident creation transforms correlated events into actionable incidents within your ticketing system. Instead of generating twenty distinct tickets for one outage, it creates a single parent incident.
This ticket contains all the collected symptoms, enrichment data, and suggested root causes attached in an organized manner. This automation keeps your service desk organized and ensures that teams work together on a single issue rather than opening competing tickets.
7. Continuous Learning and Optimization
The modern enterprise environment changes constantly, meaning correlation logic cannot remain static. Continuous learning and optimization ensures that the system improves its correlation accuracy over time. It studies how human engineers interact with the incidents it generates.
If an engineer manually ungroups two alerts, the system notes that action and updates its behavioral models. This feedback loop ensures the platform adapts to infrastructure updates, software deployments, and changing team structures without requiring constant manual rule rewrites.
Key Event Correlation Concepts Every Beginner Must Know
Events vs. Alerts vs. Incidents — Explained Simply
To master event correlation, you must first understand the distinct terminology used by IT operations teams. People often use these terms interchangeably, but they represent entirely different stages of data processing.
- Events: Any observable occurrence within your IT infrastructure. This includes normal behaviors, such as a user logging in, a backup job finishing, or a container restarting. Most events are completely harmless and require zero human attention.
- Alerts: A specific type of event that indicates a potential problem or a threshold breach. For example, a notification stating that a server’s disk space has reached 92% capacity is an alert. It signifies that someone needs to take note or take action soon.
- Incidents: A critical disruption or reduction in the quality of an IT service that requires immediate intervention. An incident is typically made up of multiple related alerts across your environment that culminate in a broken business service.
Correlation Rules and Policies
Correlation engines rely on specific logic to decide how events should be grouped together. Traditionally, this was done using static correlation methods, which are explicit rules written by human engineers. A static rule might state: “If Server A and Database B both report network latency within 30 seconds of each other, group them into a single ticket.”
While static rules are easy to understand, they are incredibly difficult to maintain in large environments. That is why modern systems use dynamic correlation policies. These policies use behavioral analytics to adjust thresholds automatically based on historical baselines, removing the need for manual rule updates.
Root Cause Analysis and Dependency Mapping
You cannot correlate events effectively if your system does not understand how your infrastructure connects. Dependency mapping provides a clear, real-time blueprint of how hardware, software, and cloud resources interact. It builds a digital map of your entire enterprise environment.
When an incident occurs, the event correlation engine uses this dependency map to trace the path of destruction. If a core network router goes offline, the system looks at the map, sees every application that relies on that router, and groups all subsequent connectivity alerts under the primary router failure.
Event Correlation in Cloud-Native Environments
Managing events in modern cloud-native environments introduces unique operational challenges. In a traditional setup, servers are permanent fixtures with fixed IP addresses. In a cloud-native world built on Kubernetes and microservices, infrastructure components are ephemeral.
Containers can spin up, handle requests, crash, and resurrect somewhere else within seconds. This constant flux creates a firehose of transient events. Event correlation platforms must use dynamic metadata, tags, and service mesh information rather than static hostnames to correlate issues effectively in these environments.
AI and Machine Learning in Event Correlation
As event volumes scale into millions per day, hardcoded rules completely break down. This scale is where artificial intelligence and machine learning become necessary for intelligent operational analytics. Modern platforms use unsupervised learning algorithms to find correlations that a human operator would never think to look for.
These algorithms analyze historical datasets to identify subtle, long-distance relationships between applications and infrastructure layers. They detect anomalies across multiple metrics simultaneously, spotting complex system degradations long before a human-defined static threshold is ever crossed.
The Four Pillars of Effective Event Correlation
To build a reliable event correlation architecture, your strategy must stand firmly upon four fundamental pillars.
+-----------------------------------------------------------------+
|               EFFECTIVE EVENT CORRELATION                       |
+-----------------+-----------------+---------------+-------------+
|    VISIBILITY   |     CONTEXT     |   AUTOMATION  | INTELLIGENCE|
|  All data from  | Logs, topology, | Auto-groups & | ML adjusts  |
|   every silo    |   & business    | auto-tickets  | baselines & |
|  in real time   |     impact      |  background   | finds patterns|
+-----------------+-----------------+---------------+-------------+
- Visibility: You must ingest data from all infrastructure silos, including networks, cloud providers, databases, and application runtimes.
- Context: Raw telemetry must be blended with asset data, topology maps, and recent deployment logs to create a clear story.
- Automation: The platform must automatically group alerts and create incidents without waiting for human confirmation or manual triage.
- Intelligence: The system must use machine learning to adapt its thresholds, recognize patterns, and minimize manual configuration.
Traditional Monitoring vs. Event Correlation — What’s the Real Difference?
The Philosophy Difference
The core difference between traditional monitoring and modern event correlation lies in their fundamental operational philosophies. Traditional monitoring operates on a purely reactive, checklist-driven philosophy. It treats your infrastructure as a collection of isolated parts, asking simple questions like: “Is this specific CPU running above 90%?” It looks at components, not systems.
Event correlation operates on a holistic, intelligent understanding philosophy. It views your infrastructure as an interconnected ecosystem where a change in one component causes ripples across the entire environment. Instead of asking if a single metric is high, it asks: “What is the overall health of the checkout service, and why are its dependencies acting unusually?”
Roles & Responsibilities Compared
This philosophical divide changes how operations teams spend their workdays. Let’s look at how daily responsibilities shift depending on which approach an organization relies upon.
- Monitoring Teams: Spend hours writing static threshold rules, modifying alert templates, and acknowledging hundreds of individual notifications. They act as human filters, manually forwarding alerts to different engineering teams.
- Operations Engineers: Focus on triaging incoming alerts, digging through separate log management tools, and trying to figure out which team actually owns the problem during an outage.
- AIOps Specialists: Focus on optimizing correlation models, integrating new data sources, and building automated remediation workflows. They design systems that resolve minor incidents automatically, freeing up humans to focus on architectural resilience.
Can Monitoring and Event Correlation Work Together?
It is important to understand that event correlation does not replace your monitoring tools; instead, it supercharges them. Think of monitoring tools as your eyes and ears, gathering raw telemetry from your applications, servers, and networks. They generate the raw observations about your infrastructure’s behavior.
Event correlation acts as the brain that interprets everything those eyes and ears observe. An integrated observability strategy combines both approaches. Your monitoring tools collect the data points, and your correlation platform analyzes those points to deliver a clear, unified incident narrative.
Which Approach Should Organizations Adopt?
Choosing where to invest your engineering resources depends entirely on your infrastructure complexity. If your organization runs a few static servers with straightforward dependencies, basic monitoring tools might be all you need to keep things running smoothly.
However, if you manage a hybrid cloud environment, microservices, or distributed applications, event correlation is no longer optional. The sheer volume of alerts generated by multi-cloud setups will quickly overwhelm a traditional monitoring strategy. Implementing correlation is the only way to scale operations without exponentially hiring more triage engineers.
Real-World Use Cases of Event Correlation
Event Correlation in Enterprise Data Centers
Large enterprise data centers contain thousands of physical servers, complex storage area networks, and intricate virtualized environments. Managing infrastructure incident management at this scale is incredibly difficult because a single hardware failure can trigger a massive cascade of software alerts.
Imagine a power supply failure in a primary network switch cabinet. Within milliseconds, hundreds of virtual machines lose network access, causing database connections to drop and application servers to fail their health checks.
An event correlation engine immediately steps in to suppress the hundreds of downstream application alarms. It identifies the network switch as the common denominator and presents the infrastructure team with a single critical incident ticket: “Network Switch Cabinet Power Failure.” The data center engineers can drive straight to the correct server rack and swap out the hardware immediately, rather than spending hours diagnosing phantom application bugs.
Cloud Operations and Microservices Monitoring
In cloud-native setups running on microservices architectures, tracking down problems is uniquely complicated due to highly distributed service structures. Applications are split into hundreds of independent services that talk to each other across dynamic container networks.
Consider a scenario where an engineering team deploys a faulty code update to a minor authentication microservice. Suddenly, the frontend application slows down, checkout transactions fail, and payment timeouts spike in another region.
[Faulty Auth Update] -> [Frontend Slowdown] -> [Checkout Failures] -> [Payment Timeouts]
                               |
                   (Correlation Engine Groups All 4)
                               |
            v------------------+------------------v
      [Single Actionable Ticket Created: Auth Service Degradation]
An event correlation engine uses distributed tracing data and service topology maps to tie these symptoms together. It traces the transaction path backward, connects the timing of the code deployment to the sudden performance drop, and alerts the cloud operations team to the exact authentication code change that triggered the widespread user failures.
Event Correlation in Financial Services
For banking and financial institutions, system uptime and transaction reliability are tightly bound to business revenue and regulatory compliance. A few minutes of downtime on a digital payment processing pipeline can result in millions of dollars in lost transactions and severe regulatory penalties.
During peak trading hours, a sudden database locking issue might slow down transaction processing times. This latency causes messaging queues to overflow and mobile banking apps to throw timeout errors to users.
Instead of routing these errors to separate application, database, and mobile development teams, the event correlation engine identifies the database lock as the single point of failure. It automatically raises the priority of the incident based on business impact data, routes it directly to the senior database administrator, and attaches the specific query causing the lock, allowing for an immediate resolution before a major service disruption occurs.
Telecommunications and Network Operations
Telecommunications companies operate massive, geodistributed networks made up of cell towers, fiber optic lines, routers, and edge data centers. These large-scale network monitoring environments handle millions of status signals every minute, making them highly susceptible to overwhelming alert storms.
When a severe storm damages a regional fiber optic cable, it does not just drop one connection; it cuts off communication to dozens of downstream cell towers and routing hubs. Each disconnected tower will instantly flood the central network operations center with critical disconnect alarms.
An event correlation engine analyzes the geographical data and logical network topology maps of the affected components. It instantly recognizes that the root cause of the silent towers is the broken regional fiber line. The system suppresses the individual tower alarms, generates a single incident map for the dispatch crew, and provides the exact coordinates of the cable break, drastically reducing repair times in the field.
Event Correlation for Growing Organizations
As mid-sized companies experience rapid business growth, their infrastructure often scales much faster than their operations teams can keep up with. These organizations must find ways to maximize operational scalability and efficiency without breaking their budgets on hiring armies of system administrators.
When a growing e-commerce company launches a major marketing campaign, traffic spikes dramatically. This surge can push legacy database instances to their limits, causing slow page loads across the site.
Without correlation, a small IT team would be buried under individual alerts from web servers, load balancers, and internal services, leading to panic and slow triage. A correlation engine automatically bundles the performance metrics, identifies the database bottleneck, and gives the lean IT team the exact clarity they need to scale up their database resources efficiently, keeping the site up during critical sales events.
Common Mistakes Organizations Make with Event Correlation
Mistake 1 — Correlating Too Many Unrelated Events
When organizations first deploy an event correlation system, they often make the mistake of setting their grouping criteria far too broad. They attempt to bundle every event happening within a specific time window into a single bucket, regardless of where those events occur in the infrastructure.
This over-correlation hides distinct, independent problems under a single giant ticket. If your application database fails at the exact same moment an unrelated office printer goes offline, grouping them together helps no one. Organizations must ensure that correlation logic requires a mix of temporal proximity, topological connection, and behavioral similarity before linking events.
Mistake 2 — Ignoring Contextual Data
An event correlation engine is only as smart as the data you feed into it. A common mistake is connecting your raw monitoring alerts to the engine while failing to provide any contextual data, such as topology maps, asset labels, or change logs.
Operating without this context leads to incomplete operational visibility. The correlation engine might see that three systems are failing simultaneously, but without a topology map, it cannot understand that they all rely on the same underlying virtual switch. To get the most out of your system, you must feed it configuration and relationship data alongside raw event streams.
Mistake 3 — Depending Entirely on Manual Rules
It is natural to start your event correlation journey by writing explicit, human-defined rules for known scenarios. However, relying entirely on manual rules creates a massive scalability bottleneck as your infrastructure evolves.
Manual Rules Matrix:
[Rule 1: If A + B -> Group] -> OK
[Rule 2: If C + D -> Group] -> OK
[Rule 500: If X + Y -> Group] -> System Changes -> Rules Break -> Manual Rewrite Needed
As developers deploy new services and modify infrastructure pathways, your manual rule book quickly becomes outdated. Engineers end up spending all their time writing, maintaining, and debugging brittle correlation rules. Successful organizations use machine learning algorithms to discover correlation patterns dynamically, keeping manual rule writing to a minimum.
Mistake 4 — Overlooking Root Cause Analysis
Sometimes, operations teams get so excited about noise reduction that they forget about resolving the underlying problems. They focus heavily on grouping alerts together to clean up their dashboards, but they fail to configure the system to surface the actual root cause of those groups.
This symptom-focused operations approach means your team gets very efficient at acknowledging grouped tickets, but they still spend too much time digging through logs to find out what actually broke. The goal of correlation is not just to reduce the number of alarms, but to point your engineers directly to the source of the failure.
Mistake 5 — Failing to Review Correlation Accuracy
Infrastructure environments change constantly, which means correlation logic requires regular evaluation. A frequent mistake is treating correlation policies as something you configure once and leave on autopilot forever.
Failing to review correlation accuracy leads to slow degradation in performance. Over time, the system may start grouping unrelated issues together or missing new patterns entirely, causing engineers to lose trust in the tool. Operations teams should establish a regular cadence to review incident data, gather feedback from engineers, and tune correlation parameters for maximum accuracy.
Mistake 6 — Treating Event Correlation as a Standalone Solution
Event correlation is incredibly powerful, but it cannot fix your operations on its own. Some organizations buy a correlation platform and expect it to magically fix messy workflows, broken code, and fragmented team communication out of the box.
Treating event correlation as an isolated tool silo limits its true value. It must be tightly integrated into your broader observability practices, incident management processes, and engineering culture. Correlation clarifies the data, but your team must still have clear workflows in place to act upon those insights effectively.
Essential Technologies Supporting Event Correlation
Monitoring and Observability Platforms
To build a reliable event correlation architecture, you need high-quality data sources to feed your correlation engine. Modern monitoring and observability platforms serve as the data collectors across your enterprise stack. Tools like Datadog, New Relic, Dynatrace, and Elastic Observability track performance metrics, collect logs, and trace application requests in real time.
These platforms observe the raw realities of your infrastructure. They monitor your systems for threshold breaches, anomalous behaviors, and errors, translating those observations into structured event streams that your correlation engine can easily analyze.
AIOps Platforms
AIOps platforms serve as the central brain of your operational data pipeline. Specialized tools like BigPanda, Moogsoft, and IBM Watson AIOps are built specifically to ingest massive streams of messy data from multiple separate monitoring tools.
These technologies use advanced machine learning algorithms to perform noise reduction, pattern recognition, and incident grouping at an enterprise scale. They break down the traditional data silos between your network, application, and cloud infrastructure teams, providing a single, unified layer of operational truth.
Incident Management Systems
Once your correlation engine has bundled raw alerts into a meaningful incident, that information must be delivered to the right people. Incident management systems like PagerDuty act as the operational response platforms that coordinate human workflows.
These tools handle on-call scheduling, alert routing, escalations, and incident collaboration. By integrating your correlation engine directly with your incident management platform, you ensure that responders receive a single, highly detailed notification containing full context rather than a barrage of disjointed pings.
Dependency Mapping and CMDB Technologies
A correlation engine cannot accurately trace the root cause of an outage if it does not know how your systems connect. Dependency mapping tools and Configuration Management Databases (CMDBs) maintain an accurate, real-time blueprint of your infrastructure topology.
These technologies track the relationships between physical servers, cloud resources, microservices, and business applications. Providing this relationship map to your correlation engine allows it to understand exactly how a failure in a foundational layer will ripple upward through your business services.
AI and Analytics Technologies
The real magic behind modern event correlation comes down to advanced machine learning-driven event intelligence. These underlying mathematical models analyze historical datasets to identify hidden trends, normal seasonal behaviors, and complex system dependencies.
Instead of waiting for a hardcoded threshold to break, these analytics engines spot subtle anomalies across multiple metrics simultaneously. This intelligence allows the system to adjust its alert filtering dynamically, flag emerging issues early, and provide predictive insights that help teams prevent downtime entirely.
Becoming an Expert in Event Correlation and AIOps
Essential Skills Every Operations Professional Needs
As enterprises transition away from traditional monitoring toward intelligent operations, the skills required for a successful career in IT operations are changing rapidly. Engineers can no longer rely solely on knowing how to read a basic uptime dashboard.
- Observability: Understanding the relationships between logs, metrics, and traces across distributed architectures.
- Data Analysis: Knowing how to parse structured event data, identify trends, and spot anomalies within large datasets.
- Scripting and Automation: Proficiency in languages like Python or Bash to build automated workflows and connect system APIs.
- Incident Management: A deep understanding of modern incident response frameworks, root cause analysis methodologies, and post-mortem practices.
Step-by-Step Learning Path
If you are looking to build expertise in event correlation and AIOps, it helps to approach your education in clear, logical stages.
[Phase 1: Fundamentals]     -> [Phase 2: Tool Mastery]      -> [Phase 3: Advanced Analytics]
- Study Linux & Networking     - Master Observability Tools    - Study Machine Learning Ops
- Learn Core ITSM/ITIL Core    - Configure Real Topology Maps  - Build Automation Pipelines
First, master the infrastructure fundamentals. Spend time learning how modern networking, cloud architectures, and operating systems function, alongside core IT Service Management frameworks.
Second, focus on mastering observability tools. Gain hands-on experience configuring monitoring agents, structuring log data, and building out live topology maps within a non-production environment.
Third, move on to advanced operational analytics. Study how machine learning models process event streams, learn to write custom correlation policies, and practice building automated self-healing remediation scripts.
Certifications and Learning Programs Worth Exploring
Earning professional certifications is an excellent way to validate your skills, stand out to enterprise employers, and keep pace with industry trends. Look into certification paths offered by major observability providers, which focus heavily on data ingestion, alert configuration, and system mapping.
Additionally, exploring vendor-neutral cloud architecture certifications will deepen your understanding of how distributed environments scale and fail. Training programs centered on modern site reliability engineering and digital operations management are also highly valuable for mastering the human workflows behind incident response.
Educational Resources with [PROVIDER_NAME]
Building deep technical expertise requires access to high-quality, practical learning materials designed by industry specialists. To help you navigate this fast-changing landscape, explore the curated educational guides and operational insights provided by [TheAIOps].
Their educational resources focus on breaking down complex AIOps, observability, and infrastructure management topics into simple, digestible concepts. Leveraging these learning materials will help you build the practical knowledge needed to design, optimize, and manage intelligent operational systems for your organization.
The Future of Event Correlation
Autonomous Operations and Self-Healing Systems
The ultimate destination for event correlation technology is moving beyond simply explaining what broke to actually fixing the problem without human intervention. We are rapidly moving toward an era of truly autonomous operations and self-healing systems.
In this future state, when a correlation engine identifies a specific root cause—such as an application container experiencing memory exhaustion—it will not just open a ticket for an engineer. Instead, the system will trigger an automated remediation playbook that safely restarts the container, clears the temporary cache, and validates system health in the background. Humans will only be pulled into the loop for complex architectural failures that require creative problem-solving.
AI-Driven Root Cause Analysis
While current correlation engines are excellent at grouping alerts and narrowing down the source of a problem, the next generation of AI-driven root cause analysis will provide unprecedented levels of predictive precision. Future platforms will combine real-time telemetry with deep generative AI capabilities.
When an incident occurs, the system will instantly analyze thousands of past code commits, structural documentation, and historical incident post-mortems. It will present responders with a natural-language summary explaining exactly what broke, why it failed, and the precise lines of code or hardware configurations that need to be updated to fix the issue permanently.
Event Correlation in Cloud-Native Architectures
As enterprise organizations continue to embrace highly distributed, multi-cloud architectures, the complexity of managing events will scale exponentially. Microservices, serverless computing, and edge networks will generate unprecedented volumes of highly transient operational data.
To survive in this world, event correlation must become entirely decentralized and hyper-dynamic. Future correlation models will be baked directly into service meshes and container orchestrators. These native platforms will observe, correlate, and resolve performance anomalies locally at the edge, preventing localized microservice hiccups from ever expanding into widespread regional outages.
Skills That Will Matter Most in Future Operations Careers
As automation and machine learning take over the repetitive aspects of alert triage, the role of the IT operations professional will continue to elevate. The engineers who thrive in future operations careers will be those who develop strong skills in observability architecture, automated playbook engineering, and operational data analytics.
Success will belong to professionals who understand how to design resilient systems, train machine learning models on infrastructure behavior, and bridge the gap between software engineering and business logic. Developing these advanced capabilities ensures you will remain an indispensable asset as enterprises embrace autonomous technology.
FAQ Section
- What is the difference between an event and an alert in IT operations?
An event is any observable occurrence within your IT infrastructure, such as a user logging in or a backup job completing, and most require zero human action. An alert is a specific type of event indicating that a threshold has been breached or a potential problem has occurred, signaling that an operations team member needs to investigate.
- How does event correlation help reduce alert fatigue for engineering teams?
Event correlation reduces alert fatigue by automatically analyzing thousands of incoming alerts, filtering out duplicates, and grouping related notifications into a single, cohesive incident ticket. This process cleans up operational dashboards, ensuring engineers only focus on real, actionable problems instead of sorting through background noise.
- Can small organizations benefit from event correlation, or is it only for enterprises?
While enterprise environments face the highest volume of alert noise, growing organizations can benefit significantly from event correlation. Implementing these systems early allows smaller, lean IT teams to scale their infrastructure efficiently, manage incidents quickly, and prevent downtime without needing to hire an army of operations engineers.
- What role does machine learning play in modern event correlation systems?
Machine learning replaces rigid, manual, human-written rules by automatically analyzing historical data to identify complex behavioral patterns and system dependencies. It allows correlation engines to adjust performance baselines dynamically, spot hidden anomalies across multiple metrics simultaneously, and maintain accurate grouping logic as infrastructure changes.
- How does dependency mapping support accurate root cause analysis?
Dependency mapping builds a live, real-time blueprint of how hardware, software, and cloud applications interact across your entire ecosystem. When an outage occurs, the correlation engine uses this map to trace the exact path of the failure, allowing it to suppress downstream symptoms and point engineers directly to the root cause component.
- What career paths are available for professionals who specialize in AIOps and event correlation?
Professionals specializing in these areas can pursue high-demand roles such as Site Reliability Engineer (SRE), Observability Architect, AIOps Specialist, Cloud Operations Engineer, and IT Infrastructure Manager. These positions focus on designing intelligent tracking systems, building automated remediation workflows, and managing modern enterprise cloud environments.
- What is the danger of over-correlating IT events?
Over-correlation occurs when a system’s grouping logic is too broad, causing it to bundle entirely unrelated issues together just because they happened at the same time. This can accidentally hide distinct, independent problems under a single ticket—like grouping a critical database failure with a broken office printer—which confuses responders and delays resolution.
- How does event correlation integrate with existing ITIL or ITSM frameworks?
Event correlation acts as the high-speed data processor that feeds directly into your IT Service Management (ITSM) workflows. Instead of creating a messy flood of individual tickets, the correlation engine acts at the Incident Management stage to deliver a single, enriched, pre-triaged incident file directly to your service desk software.
- What is the difference between static and dynamic correlation methods?
Static correlation relies on explicit, human-written “if/then” rules that specify exactly how certain alerts should group together, which requires constant manual maintenance as systems change. Dynamic correlation uses machine learning algorithms to evaluate real-time data streams and automatically adjust grouping logic based on shifting infrastructure baselines.
- What are the first steps an organization should take when adopting event correlation?
Organizations should start by auditing their existing monitoring tools and consolidating their data streams into a single, centralized platform. Once visibility is unified, the next step is to feed the system accurate topology data before turning on basic baseline machine learning models to gradually clean up duplicates and reduce background noise.
Final Summary
Managing modern IT infrastructure requires moving away from the chaotic, reactive workflows of traditional monitoring. Drowning in repetitive alerts, fighting endless alert storms, and guessing at the source of system failures costs organizations valuable time, energy, and revenue. Event correlation provides the vital intelligence layer needed to transform raw, noisy infrastructure data into clear, actionable operational insights.
By embracing the core principles of alert aggregation, noise reduction, and automated incident creation, teams can collapse thousands of scattered notifications into single, meaningful incidents. This approach dramatically accelerates incident resolution, protects engineers from alert fatigue, and provides the clear visibility required to maintain enterprise system uptime.