Upgrade & Secure Your Future with DevOps, SRE, DevSecOps, MLOps!
We spend hours scrolling social media and waste money on things we forget, but won’t spend 30 minutes a day earning certifications that can change our lives.
Master in DevOps, SRE, DevSecOps & MLOps by DevOps School!
Learn from Guru Rajesh Kumar and double your salary in just one year.
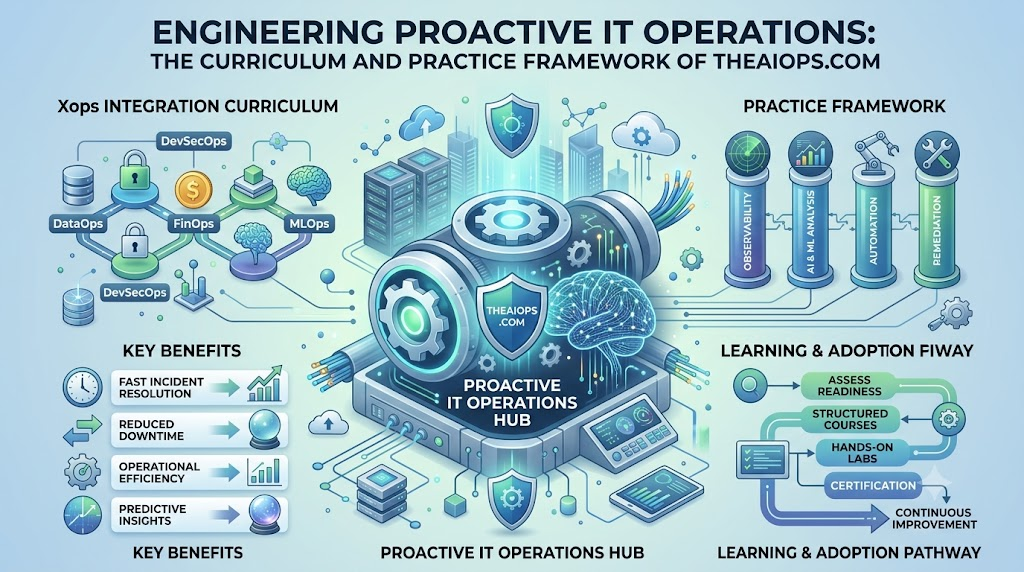
Traditional enterprise IT operations remain trapped in reactive break-fix cycles. Monitoring stacks generate thousands of fragmented alerts, support engineers triage symptoms under high-stress war-room conditions, and post-mortems focus on restoring service rather than eliminating recurring operational failure modes. Moving beyond this paradigm requires more than deploying an AIOps vendor platform; it requires an architectural and operational mindset shift. The technical curriculum and operational blueprints at TheAIOps.com focus on structuring proactive problem-solving as a repeatable engineering discipline. By combining telemetry pipelines, algorithmic noise reduction, deterministic automated remediation, and statistical anomaly detection, operations teams learn to address degradation before users experience service interruption.
The Paradigm Shift: Reactive Triage vs. Proactive AIOps
Proactive operations are grounded in the difference between static alerting and dynamic observability:
| Operational Dimension | Reactive Legacy IT | Proactive AIOps Engineering |
| Primary Trigger | Hard thresholds (e.g., CPU > 85%, HTTP 500 spike) | Multi-variate anomaly detection and metric drift |
| Telemetry Context | Siloed dashboards (Metrics, Logs, APM separated) | Unified, context-graph enriched telemetry |
| Noise Profile | Alert storms, high operational fatigue | Dynamic alert clustering, topological deduplication |
| Root-Cause Analysis | Manual log scouring, cross-functional war rooms | Algorithmic causality analysis, dependency mapping |
| Remediation Action | Human-run runbooks and manual restarts | Automated closed-loop or policy-driven human-in-the-loop actions |
| Post-Incident Value | Static incident reports with limited actionability | Automated feedback loop into telemetry thresholds and chaos tests |
Core Pillars of the Proactive Engineering Curriculum
+-----------------------------------------------------------------------+
|                       Unified Telemetry Pipeline                      |
|            (OpenTelemetry, eBPF, Context Graphs, Topology)            |
+-----------------------------------+-----------------------------------+
                                    |
                                    v
+-----------------------------------------------------------------------+
|                    Algorithmic Noise Reduction Engine                 |
|               (Topology Deduplication, Time-Series DBSCAN)            |
+-----------------------------------+-----------------------------------+
                                    |
                                    v
+-----------------------------------------------------------------------+
|                     Continuous Proactive Detection                    |
|          (Dynamic Baselines, Predictive Drift, Multi-variant)         |
+-----------------------------------+-----------------------------------+
                                    |
                                    v
+-----------------------------------------------------------------------+
|                  Closed-Loop Remediation & Automation                 |
|           (Event-Driven Webhooks, Runbooks, Safety Circuitry)         |
+-----------------------------------------------------------------------+
1. High-Fidelity Data Architecture and Context Stitching
Proactive problem-solving requires clean, contextualized telemetry. Learners build streaming pipelines using OpenTelemetry (OTel) collectors, Prometheus/Mimir, and vector pipelines. The instruction centers on avoiding “garbage-in, garbage-out” machine learning:
- Context Graphs: Mapping how a database slow-query trace connects to a container’s cgroup memory pressure and an upstream Kubernetes ingress route.
- Kernel-Level Visibility: Leveraging extended Berkeley Packet Filters (eBPF) to capture network and process latency without invasive code instrumentation.
2. Algorithmic Noise Reduction and Alert Correlation
Raw alert streams obscure genuine systemic issues. The curriculum teaches engineers how to construct deterministic and statistical deduplication filters:
- Topological Clustering: Correlating alerts based on service dependencies rather than temporal alignment alone.
- Density-Based Clustering (DBSCAN): Grouping anomalous events across microservices during release rollouts to isolate single points of origin.
3. Dynamic Baselines vs. Static Thresholds
Static rules fail in cloud-native environments characterized by diurnal traffic patterns, micro-deployments, and autoscaling. Training focuses on deploying dynamic statistical models:
- Holt-Winters and STL Decomposition: Isolating trend, seasonality, and residual noise from time-series metrics.
- Z-Score and Quantile-Based Drift: Flagging metric divergence when behavior strays outside expected probability distributions, catching memory leaks hours before Out-Of-Memory (OOM) kills trigger.
4. Event-Driven Closed-Loop Remediation
Identifying problems early is only half the battle; systems must react safely without requiring constant manual intervention. Engineers build automated response workflows with integrated guardrails:
- Circuit Breakers: Automating actions (e.g., traffic shedding, connection pool draining, cache eviction) while enforcing limits to prevent automated cascades.
- Policy Governance: Integrating Open Policy Agent (OPA) to validate remediation triggers against deployment states.
Architectural Deep Dive: Predictive Memory Degradation
The following workflow demonstrates the proactive pattern taught for catching creeping leaks before services hit hard resource boundaries:
[ Pod Telemetry via OTel ]
            │
            ▼
[ Time-Series Store (Prometheus) ]
            │
            ▼
[ Linear Trend Evaluation / Moving Average (Python Controller) ]
            │
            ├─► Rate of Growth > Baseline Threshold?
            │         │
            │         ├─ Yes: Project Time-to-Exhaustion (TTE)
            │         │         │
            │         │         └─► TTE < 4 Hours?
            │         │                   │
            │         │                   ├─ Yes: Trigger Proactive Remediation
            │         │                   └─ No:  Update Anomaly Score Index
            │         │
            │         └─ No: Maintain Rolling Window
            ▼
[ Automated Action: Graceful Drain -> Thread Dump -> Rolling Restart ]
Reference Implementation: Predictive Threshold Exporter
This lightweight pattern calculates the consumption slope of a process over a sliding window, predicting depletion events hours in advance:
Python
import numpy as np

def calculate_time_to_exhaustion(timestamps: list[float], memory_usage_mb: list[float], limit_mb: float) -> float:
    """
    Calculates the projected time (in seconds) until memory exhaustion based on
    linear regression over a sliding operational window.

    Returns -1.0 if consumption rate is flat or decaying.
    """
    if len(timestamps) < 10 or len(timestamps) != len(memory_usage_mb):
        return -1.0

    x = np.array(timestamps) - timestamps[0]
    y = np.array(memory_usage_mb)

    # Calculate slope (m) and intercept (c): y = mx + c
    A = np.vstack([x, np.ones(len(x))]).T
    slope, intercept = np.linalg.lstsq(A, y, rcond=None)[0]

    # Zero or negative slope indicates stability or memory clearance
    if slope <= 0.001:
        return -1.0

    current_usage = y[-1]
    remaining_capacity = limit_mb - current_usage

    if remaining_capacity <= 0:
        return 0.0

    time_to_exhaustion_seconds = remaining_capacity / slope
    return float(time_to_exhaustion_seconds)
Operational Trade-Offs and Failure Modes
Proactive systems introduce structural complexity that must be managed intentionally:
                  Complexity vs. Operational Risk

   Low Automated Safety ◄──────────────────────► High Automated Safety
   ┌───────────────────────┐            ┌────────────────────────────┐
   │ Aggressive Thresholds │            │ Conservative Guardrails    │
   │ - Risk: False Positives│            │ - Risk: Leaks Slip Through │
   │ - High Alert Churn    │            │ - Zero Premature Restarts  │
   │ - Automation Thrashing│            │ - Requires Longer Baselines│
   └───────────────────────┘            └────────────────────────────┘
- The Fallacy of the “Magic Black Box”: Off-the-shelf unsupervised models applied to raw infrastructure metrics without semantic topology often flag harmless, transient load spikes as critical incidents. Proactive setups succeed only when models understand application structure.
- Automation Thrashing: Poorly designed automated runbooks can trigger cascading restarts across microservice tiers. Proactive triggers must have bounded execution frequencies, backoff controls, and global circuit breakers.
- Telemetry Overhead: Collecting high-frequency spans and profiling metrics across every service introduces storage penalties and network overhead. Systems must utilize adaptive sampling to balance observability with operational cost.
Frequently Asked Questions
How does proactive problem-solving differ from traditional synthetic monitoring?
Synthetic monitoring tests predefined, deterministic paths, such as executing an HTTP check or headless browser login every 60 seconds from specific nodes. While useful for validating external uptime, it cannot detect gradual backend degradation, asynchronous worker thread starvation, or multi-tenant database contention until transaction times cross hard thresholds.
Can proactive remediation run safely without human approval?
Yes, provided the execution domain is strictly constrained by blast-radius limits and rate controls. Production implementations begin in advisory mode, surfacing remediation steps directly to engineers to validate accuracy.
What core technical skills do infrastructure engineers need to implement these workflows?
Engineers must move beyond static dashboard assembly. The essential skill set requires proficiency in OpenTelemetry data pipelines, distributed tracing schemas, core statistical models (linear regression, moving variance, seasonality decomposition), container networking primitives (eBPF, service meshes), and configuration management tools capable of deterministic programmatic execution.
How does an AIOps pipeline differentiate transient load spikes from genuine anomalies?
Advanced pipelines apply time-series decomposition algorithms, such as Seasonal and Trend decomposition using Loess (STL) or Holt-Winters modeling, alongside dynamic baselines. By filtering out cyclic diurnal traffic and anticipated recurring jobs, the engine isolates residual variance. If a metric jump corresponds with a proportionate capacity increase and remains within normal quantile bounds, the system suppresses alerts; if the change breaks cross-metric correlation rules, it flags an anomaly.
Why do topology graphs matter for proactive alerting?
Alert storms occur because a single underlying fault in a distributed system, such as a database locking bottleneck, cascades downstream across dozens of dependent microservices.
What role does OpenTelemetry play in proactive training environments?
OpenTelemetry provides a vendor-neutral, unified standard for emitting traces, metrics, and logs with semantic conventions. Rather than managing proprietary agent silos that lock telemetry into distinct formats, OTel standardizes contextual metadata, such as service names, container identifiers, and trace IDs. This consistency allows correlation models to trace causation directly from an application span down to host-level metrics.
How do teams prevent automation thrashing during cascading failures?
Automation thrashing occurs when automated healing scripts fight with underlying platform controllers, such as Kubernetes Horizontal Pod Autoscalers or restart loops. Mitigating this risk requires implementing distributed mutex locks, dead-man timers, and circuit breakers.
How does predictive capacity planning transition from a batch task to real-time operations?
Traditional capacity planning evaluates historical trends over monthly or quarterly spreadsheets. Real-time proactive operations execute micro-forecasting directly on live metric streams.
What are the biggest barriers organizations face when moving to proactive IT?
The primary barrier is cultural and procedural rather than purely technical. Many operations teams are incentivized around Mean Time to Resolve (MTTR) rather than Mean Time Between Failures (MTBF).
How does chaos engineering complement proactive problem-solving?
Chaos engineering intentionally injects targeted faults—such as network packet loss, artificial CPU stress, or node terminations—into controlled environments. This practices validates that detection algorithms correctly identify degradation patterns before an outage occurs, and confirms that automated runbooks and circuit breakers behave predictably when real-world production failures strike.
Conclusion
Proactive IT problem-solving shifts operations from urgent, stress-driven triage to disciplined software and reliability engineering. Organizations that master high-fidelity telemetry, dynamic statistical baselining, topology-based noise reduction, and bounded automated remediation stop managing emergencies and start engineering resilient systems. The training framework at TheAIOps.com equips practitioners to move past monitoring symptoms, providing the operational frameworks and technical foundations required to build self-healing, highly observable architectures.
