Upgrade & Secure Your Future with DevOps, SRE, DevSecOps, MLOps!
We spend hours scrolling social media and waste money on things we forget, but won’t spend 30 minutes a day earning certifications that can change our lives.
Master in DevOps, SRE, DevSecOps & MLOps by DevOps School!
Learn from Guru Rajesh Kumar and double your salary in just one year.
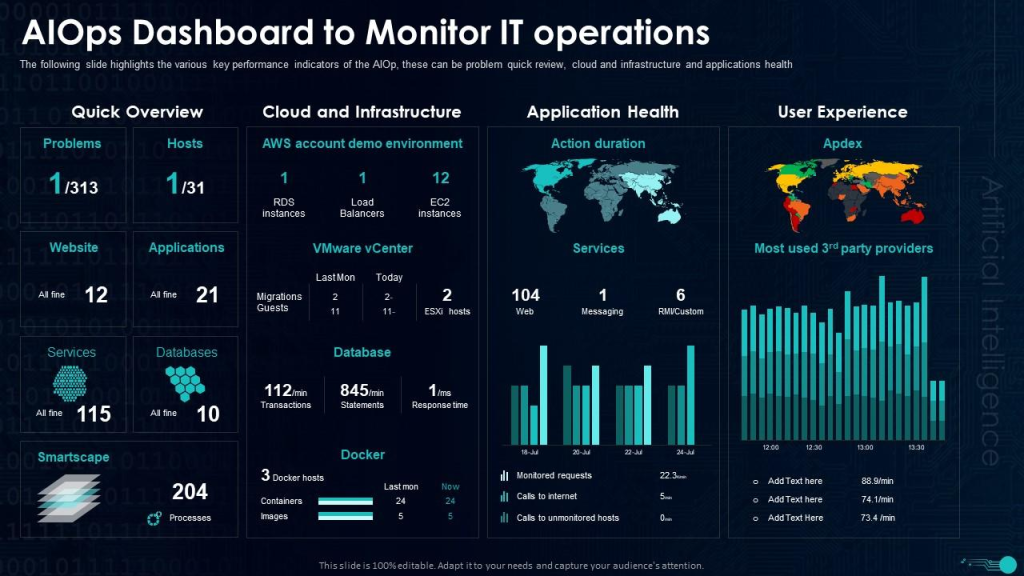
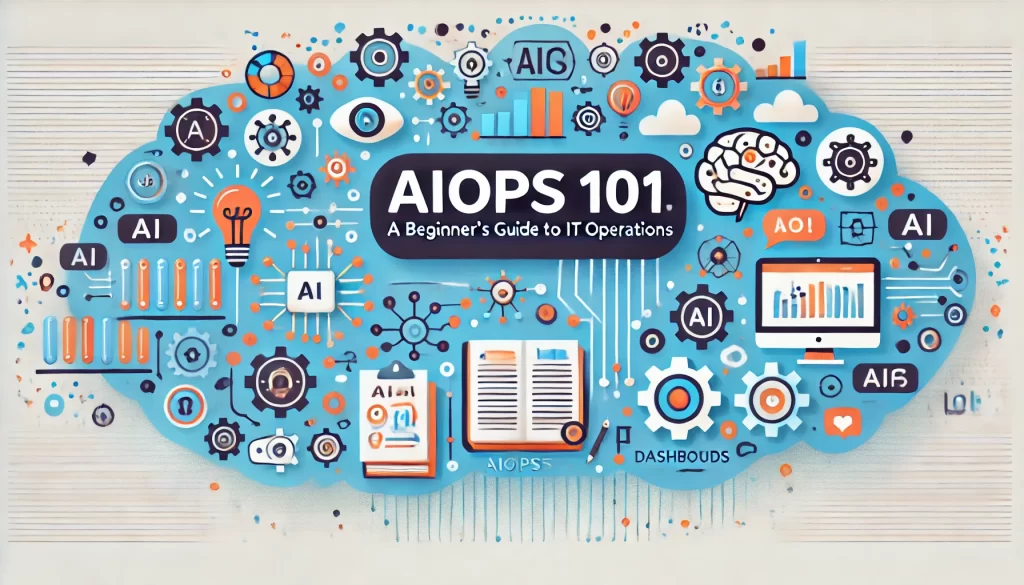
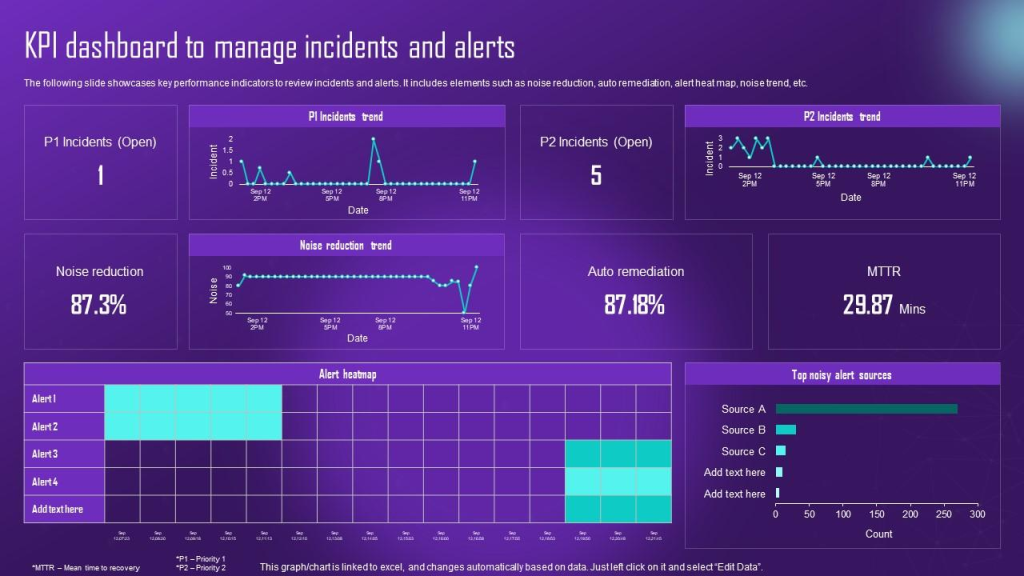
How to Create an AIOPS Dashboard: A Comprehensive Guide
Are you looking to take your IT operations to the next level? Do you want to maximize the efficiency of your IT infrastructure and ensure that your systems are performing at their best? If so, then an AIOPS (Artificial Intelligence for IT Operations) dashboard may be just what you need.
In this guide, we’ll take a deep dive into the world of AIOPS dashboards and explore everything you need to know to get started. From understanding the basics of AIOPS to selecting the right tools and technologies, we’ve got you covered.
What is an AIOPS Dashboard?
Before we dive into the details of how to build an AIOPS dashboard, let’s first take a moment to define what it is.
In simple terms, an AIOPS dashboard is a tool that provides real-time insights into the performance and health of your IT infrastructure. It uses machine learning algorithms to analyze data from various sources, including logs, metrics, and events, to identify and diagnose issues before they become major problems.
An AIOPS dashboard can help you:
- Reduce downtime and improve system availability
- Streamline IT operations and increase efficiency
- Identify and resolve issues faster
- Optimize resource utilization
- Improve customer satisfaction
Getting Started with AIOPS
Now that you have a basic understanding of what AIOPS is, let’s get started with building your own AIOPS dashboard.
Step 1: Define Your Objectives
The first step in building an AIOPS dashboard is to define your objectives. What are your primary goals for using AIOPS? Do you want to improve system availability, reduce downtime, or optimize resource utilization?
Once you have a clear understanding of your objectives, you can begin to identify the data sources that will be needed to achieve those goals.
Step 2: Identify Your Data Sources
The next step in building an AIOPS dashboard is to identify the data sources that you will need to collect and analyze. This may include logs, metrics, and events from various systems and applications.
Some common data sources for AIOPS include:
- Network devices
- Servers
- Databases
- Applications
Step 3: Select Your AIOPS Tools and Technologies
Once you have identified your data sources, the next step is to select the right tools and technologies for your AIOPS dashboard.
Some popular AIOPS tools and technologies include:
- Elasticsearch
- Grafana
- Prometheus
- Nagios
- Zabbix
When selecting your tools and technologies, it’s important to consider factors such as ease of use, scalability, and integration with your existing systems.
Step 4: Design Your Dashboard
The final step in building an AIOPS dashboard is to design your dashboard. This involves selecting the appropriate visualizations and layout for your data.
Some common visualizations for AIOPS dashboards include:
- Line charts
- Bar charts
- Pie charts
- Heat maps
When designing your dashboard, it’s important to keep in mind the end user and their specific needs. You want to create a dashboard that is easy to read and provides actionable insights.
Best Practices for AIOPS Dashboard Design
Now that you have a basic understanding of how to build an AIOPS dashboard, let’s explore some best practices for designing an effective dashboard:
1. Keep it Simple
One of the most important principles of dashboard design is to keep it simple. Avoid cluttering your dashboard with too much information or visualizations. Instead, focus on the most important metrics and data points.
2. Use Color Effectively
Color can be a powerful tool for highlighting important information and drawing attention to key areas of your dashboard. However, it’s important to use color effectively and avoid using too many colors or conflicting color schemes.
3. Incorporate Interactive Elements
Interactive elements such as dropdown menus and drill-down charts can help users to explore data in greater detail and identify trends and patterns.
4. Test and Iterate
Finally, it’s important to test and iterate on your dashboard design. Solicit feedback from end users and make adjustments as needed to ensure that your dashboard is providing the most value possible.
Conclusion
An AIOPS dashboard can be a powerful tool for streamlining IT operations, improving system availability, and optimizing resource utilization. By following the steps outlined in this guide and incorporating best practices for dashboard design, you can create an effective AIOPS dashboard that provides actionable insights and drives business value.