Upgrade & Secure Your Future with DevOps, SRE, DevSecOps, MLOps!
We spend hours scrolling social media and waste money on things we forget, but won’t spend 30 minutes a day earning certifications that can change our lives.
Master in DevOps, SRE, DevSecOps & MLOps by DevOps School!
Learn from Guru Rajesh Kumar and double your salary in just one year.
Introduction
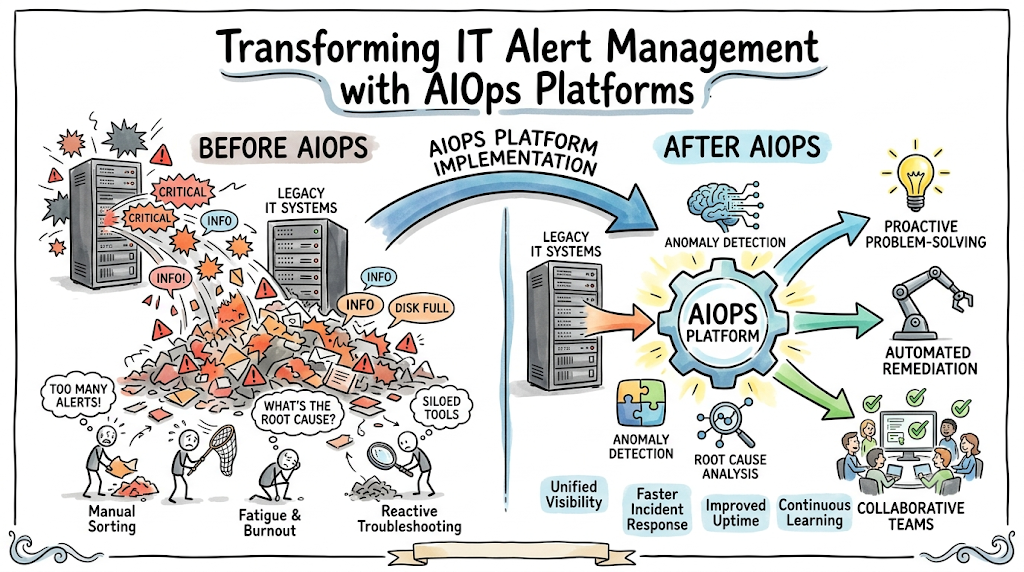
Modern enterprise environments have evolved past the point of manual oversight. The shift from monolithic data centers to hybrid cloud topologies, ephemeral microservices, and Kubernetes clusters has made system visibility highly complex. Every single layer of your infrastructure stack—from container runtimes and application meshes to cloud databases and CDN networks—constantly generates telemetry data. When a failure happens, this interconnected web triggers a massive wave of downstream alerts. This is where TheAIOps changes the game. By applying artificial intelligence and machine learning to high-velocity telemetry pipelines, TheAIOps.com helps teams cut through the noise, group related events automatically, and find the root cause of complex system incidents before they impact customers.
Featured Snippet
How Does TheAIOps.com Simplify IT Alert Management?
TheAIOps.com simplifies IT alert management by deploying machine learning algorithms to ingest, deduplicate, and correlate thousands of scattered monitoring notifications into a single, contextual incident. By automating root cause analysis and filtering out up to 90% of operational noise, it allows engineering teams to focus exclusively on critical, actionable system issues.
Understanding IT Alert Management Challenges
Traditional monitoring frameworks operate on a simple model: you set a static threshold, and if the system crosses it, an alert is sent. While this worked well for predictable, monolithic applications, it falls short in modern, distributed environments.
Traditional Monitoring:  [Metric > Static Threshold] ──► [Immediate Alert Sent]
AIOps Monitoring:      [Telemetry Pipeline] ──► [ML Noise Filter & Context Engines] ──► [Single Contextual Incident]
Explosion of Monitoring Tools
To gain visibility across different layers, enterprises often deploy separate tools for each stack component: one for network performance, another for application performance monitoring (APM), a third for cloud infrastructure, and a separate platform for log aggregation. Each tool operates in its own silo, completely unaware of the others. When a major incident occurs, every tool sends its own set of warnings independently.
Alert Overload Problem
Because these siloed monitoring tools lack contextual awareness, they generate thousands of notifications daily. On-call engineers are inundated with emails, Slack pings, and PagerDuty notifications. This constant influx causes alert fatigue, making it easy for engineers to overlook a critical, revenue-impacting infrastructure failure hidden among thousands of minor warnings.
False Positives & Noise
Static metrics do not account for natural business cycles. For example, a 70% CPU utilization spike at 3:00 PM on a Friday might be standard behavior, while the same spike at 3:00 AM on a Sunday could indicate a malicious attack or a stuck thread pool. Static systems cannot differentiate between these scenarios, leading to frequent false positives that waste valuable engineering hours.
Manual Incident Handling Issues
When an incident bypasses basic filters, tracking down its origin remains a manual process. Teams must log into different platforms, manually align time stamps across various tools, and join cross-functional war rooms to determine which component failed first. This manual approach increases triage times and keeps engineers focused on firefighting instead of building features.
Special Learning Framework: IT Alert Management Challenges
- In Simple Terms: Imagine living in a house where the fire alarm, security system, toaster, and washing machine all use the exact same loud siren. If the washing machine finishes a cycle, your house treats it like a major emergency, forcing you to check every room to ensure nothing is actually on fire.
- Real-World Example: A global logistics company ran five different enterprise monitoring platforms across their logistics tracking stack. During a routine network switch update, the systems fell out of sync, triggering 12,000 automated alert emails within an hour. The on-call engineering team missed an actual database drive failure because it was buried deep within that massive wave of notifications.
- Why It Matters: High alert volume drains engineering productivity, burns out top talent, and causes long outages that directly impact company revenue and customer trust.
Key Takeaways
- Using multiple isolated monitoring tools leads to fragmented data silos and redundant notifications.
- Static thresholds fail to adjust for normal daily or weekly business cycles, generating high numbers of false positives.
- Manual incident correlation keeps teams in a reactive state, driving up triage costs and MTTR.
What Is Intelligent Alert Management in AIOps?
Intelligent alert management shifts operational workflows from manual, threshold-based triage to an automated, data-driven approach. Instead of treating every event as an isolated incident, an AIOps-driven platform treats incoming alerts as interrelated data points within a larger system architecture.
Definition of AI-Driven Alerting
AI-driven alerting uses machine learning algorithms to ingest, clean, and process multi-source telemetry data in real time. It automatically groups related alerts, filters out non-actionable background noise, and adds rich context to operational issues before an engineer ever opens a ticket.
How Machine Learning Changes Alerts
Instead of relying on rigid, hardcoded rules written by engineers, machine learning models analyze your historical alert data, system topologies, and real-time event logs. The platform learns the normal baseline behaviors of your infrastructure, allowing it to identify complex anomalies across entirely different infrastructure layers without needing manual threshold configuration.
Shift from Reactive to Proactive Monitoring
Traditional monitoring alerts you after a service fails or goes offline. AIOps shifts this dynamic by recognizing subtle, early-stage signs of degradation—such as a slow increase in memory consumption combined with gradual queue backlogs. This allows the system to flag potential issues before they escalate into user-facing outages.
Special Learning Framework: Intelligent Alert Management
- In Simple Terms: Instead of giving you a separate notification for every broken part, an intelligent alerting system acts like an experienced mechanic. It looks at all the dashboard warning lights, listens to the engine sound, and tells you exactly which part needs to be replaced.
- Real-World Example: An enterprise retail platform uses machine learning to monitor its checkout process. When a payment gateway begins slowing down, the AIOps engine detects the trend and flags it 15 minutes before the gateway reaches its hard failure threshold, allowing the team to reroute traffic smoothly.
- Why It Matters: Moving from reactive alerts to intelligent context helps teams stop fighting fires and instead focus on maintaining system availability and reliability.
Key Takeaways
- AIOps replaces static, manual thresholds with dynamic behavioral baselines.
- Machine learning models connect dots across different infrastructure layers automatically.
- Proactive detection allows engineering teams to resolve underlying system degradation before it leads to critical downtime.
How TheAIOps.com Simplifies IT Alert Management
The platform offered by TheAIOps.com addresses enterprise operational complexity directly by transforming chaotic alert streams into clear, actionable insights.
Multi-Source Alert Stream ──► [ TheAIOps.com Engine ] ──► Structured Incident Graph + Root Cause
Smart Alert Correlation
TheAIOps.com analyzes incoming alerts across your network, infrastructure, and application layers. By evaluating precise event timestamps, application topology mappings, and historical alert behavior, the platform correlates thousands of scattered alerts into a single, cohesive incident ticket.
Noise Reduction Using ML
The platform filters out non-actionable notifications, repetitive status pings, and transient spikes that resolve themselves within seconds. This machine learning-driven filtering reduces overall alert volume by up to 90%, leaving engineers with a clean, focused queue of issues that actually require human intervention.
Priority-Based Alerting
Not all alerts carry the same operational weight. TheAIOps.com evaluates the critical nature of an event by analyzing its position within your infrastructure topology and its potential blast radius. A downstream staging server error is automatically deprioritized, while an anomaly on a production checkout microservice is immediately routed to the top of the queue.
Root Cause Detection
When an incident occurs, the platform traces the event sequence backward through your system topology. By identifying the initial failure point that triggered the downstream cascade, it highlights the probable root cause, saving teams from manually digging through logs across different departments.
Event Grouping & Deduplication
If a faulty network switch causes a server to disconnect and reconnect fifty times in ten minutes, traditional systems will send fifty individual alerts. TheAIOps.com automatically catches these duplicates, merging them into a single open incident that updates in real time as new events arrive.
Predictive Alerting
By analyzing long-term performance trends and historical telemetry data, the platform identifies early signs of resource exhaustion, disk space saturation, or memory leaks. It alerts teams hours in advance, providing clear recommendations to fix the issue before performance degrades.
Special Learning Framework: TheAIOps.com Capabilities
- In Simple Terms: TheAIOps.com acts like a smart assistant for your on-call team. It filters out spam notifications, groups related issues together, and hands you a single folder showing exactly what broke, why it happened, and how to fix it.
- Real-World Example: During a major cloud region disruption, an insurance provider using TheAIOps.com saw 8,500 raw alerts automatically condensed into two high-priority incidents, complete with a clear guide pointing to the broken network link.
- Why It Matters: Grouping alerts and finding root causes automatically helps teams dramatically cut down their triage times, reducing MTTR from hours to just a few minutes.
Key Takeaways
- TheAIOps.com uses advanced pattern and topology mapping to consolidate multi-source alerts into a single incident.
- Automated deduplication prevents on-call engineers from getting flooded with repeated notifications for the same issue.
- Predictive alerts give teams the advanced notice they need to resolve issues before users are impacted.
Machine Learning Behind Alert Management
Understanding how AIOps platform engines work helps demystify how they manage and simplify large volumes of alert data.
Pattern Recognition
The platform processes text fields from logs, error codes, and alert descriptions using Natural Language Processing (NLP) and clustering algorithms. This allows it to recognize when different monitoring tools are describing the exact same underlying issue, even if they use different terminology.
Anomaly Detection
The system builds dynamic mathematical baselines for every metric it monitors. It accounts for daily patterns, seasonal variations, and holiday traffic shifts. An alert is triggered only when a metric deviates significantly from its calculated normal range, rather than when it crosses an arbitrary, fixed number.
Historical Data Learning
Every time an incident is processed, the platform learns from how your team responds. It tracks which alerts were marked as false positives, which ones were closed without action, and which ones required immediate code patches, using these historical data points to continuously refine its filtering models.
Predictive Modeling
Using time-series forecasting models, the platform projects resource usage trends into the future. For instance, it evaluates current write rates alongside available disk space to predict exactly when a database volume will run out of storage capacity.
Continuous Feedback Loop
The machine learning models are not static; they adapt in real time. As your engineering teams modify infrastructure, deploy new microservices, or adjust system architectures, the platform updates its underlying baselines and correlation patterns without requiring manual retraining.
Traditional Monitoring vs. AIOps Alert Management
| Feature | Traditional Monitoring | AIOps-Based Alert Management |
| Ingestion Speed | Fast, but restricted to rigid data silos. | Real-time across all telemetry sources simultaneously. |
| Alert Accuracy | Low; prone to false positives from static limits. | High; based on dynamic, context-aware baselines. |
| System Scalability | Fails in dynamic, ephemeral cloud systems. | Built for highly distributed microservices. |
| Noise Handling | None; routes every single alert to the queue. | Filters out up to 90% of non-actionable noise. |
| Automation Level | Manual configuration and updates required. | Automated discovery, filtering, and correlation. |
| RCA Capability | Requires manual timeline cross-matching. | Automatically identifies the probable root cause. |
Real-World Use Cases
Cloud Infrastructure Monitoring
- Challenge: A SaaS provider migrated to a multi-region Kubernetes setup. Minor network blips between cloud regions triggered hundreds of duplicate container restart notifications every day, overwhelming the SRE team.
- Solution: The team integrated TheAIOps.com to ingest alert streams from cloud infrastructure logs and container runtimes.
- Outcome: The platform recognized these transient blips as self-healing events, automatically deduplicating the noise and reducing infrastructure alerts by 85%.
Banking System Incident Handling
- Challenge: A financial institution experienced a core payment gateway failure. The resulting wave of downstream alerts flooded the NOC team, making it impossible to quickly isolate the root cause while transactions failed.
- Solution: The bank deployed an AIOps solution to automatically map system dependencies and correlate alerts by transaction paths.
- Outcome: The system pinpointed a misconfigured database connection pool as the root cause within 90 seconds, allowing engineers to quickly restore payment processing.
E-commerce Traffic Spikes
- Challenge: During a major flash sale, an e-commerce site experienced massive traffic spikes. Static monitoring tools triggered widespread high-CPU warnings across web servers, masking a real database deadlock.
- Solution: The platform applied dynamic baselines that accounted for the anticipated holiday traffic increase.
- Outcome: The system ignored the expected high CPU utilization and highlighted the database deadlock immediately, preventing an extended checkout outage.
SaaS Application Reliability
- Challenge: A collaborative software platform suffered from intermittent API performance drops that frustrated users but never lasted long enough to trigger traditional static uptime alerts.
- Solution: The platform used anomaly detection models to monitor long-tail latencies across all API endpoints.
- Outcome: The system detected a slow memory leak in a minor microservice, allowing developers to patch the code before it could cause a wider application crash.
Hybrid Cloud Alert Management
- Challenge: An enterprise enterprise relied on a complex mix of on-premises mainframes and modern public cloud infrastructure, leaving teams without a unified view of alerts across environments.
- Solution: They deployed TheAIOps.com to consolidate metrics, logs, and events from both environments into a unified dashboard.
- Outcome: The operations team gained a single view of their entire infrastructure, allowing them to track and resolve cross-environment issues without switching tools.
Benefits of Intelligent Alert Management
   [90% Noise Reduction]       ► Fewer interruptions, zero alert fatigue.
            │
   [Automated Root Cause]      ► MTTR drops from hours to minutes.
            │
   [Dynamic Baselining]        ► Fewer false alarms, higher operational trust.
            │
   [Proactive Optimization]    ► Issues solved before impacting users.
Reduced Alert Fatigue
By filtering out background noise and deduplicating repetitive alerts, your engineering teams can focus on a clean, manageable stream of critical notifications. This reduces burnout and ensures that high-priority issues get the attention they need right away.
Faster Incident Resolution
Instead of spending the first hour of an outage manually piecing together timelines from different tools, engineers receive a correlated incident ticket complete with root-cause analysis. This dramatically reduces Mean Time to Detection (MTTD) and Mean Time to Resolution (MTTR).
Improved System Reliability
Catching system degradation early allows your teams to resolve underlying performance issues before they impact end users. This leads to higher overall uptime, more stable system performance, and a more reliable user experience.
Lower Operational Cost
Fewer high-priority outages mean less revenue lost to downtime. Additionally, automating the tier-1 triage process allows your operations teams to scale efficiently without needing to constantly hire more manual triage staff.
Better Team Productivity
When engineers spend less time firefighting and sorting through false positives, they can dedicate more time to high-value projects, like optimizing architecture, building new features, and automating routine infrastructure tasks.
Key Features of TheAIOps.com Platform
- Real-Time Alert Processing: Ingests millions of metric data points and event logs per second from all your enterprise monitoring tools without introducing processing delays.
- AI-Based Incident Grouping: Automatically groups related alerts into a single unified incident using advanced clustering algorithms and topology analysis.
- Dashboard Observability: Provides a clear, unified view of your entire infrastructure health, making it easy for teams to understand system status at a glance.
- Automated Root Cause Analysis: Traces failure chains back to the primary source, highlighting the exact code deploy, infrastructure failure, or configuration change that triggered the issue.
- Integration with ITSM Tools: Connects seamlessly with popular IT Service Management and collaboration platforms like Jira Service Management, ServiceNow, Slack, and PagerDuty.
How IT Teams Work With AIOps Alerts
Transitioning to an AIOps-driven workflow updates how your operations team handles incidents from start to finish.
[Ingest Multi-Source Data] ──► [Correlate & Enrich Context] ──► [Prioritize Blast Radius] ──► [Automated Action/Route]
Alert Ingestion Flow
The platform sits at the center of your operations ecosystem, continuously ingesting raw telemetry data, logs, events, and metrics from all your disparate monitoring tools through secure APIs and webhooks.
Event Correlation Process
As data flows through the ingestion engine, machine learning models analyze timestamps, cross-system dependencies, and text patterns to group related events into a single, contextual incident.
Incident Prioritization Workflow
The system evaluates the business impact of the grouped incident by reviewing your infrastructure topology. It assigns an accurate severity level based on real-world blast radius, ensuring critical issues rise to the top of the queue.
Resolution Automation
Once an incident is verified, the platform can trigger automated remediation playbooks—such as restarting a stuck service, scaling a cluster, or clearing a temporary cache volume—resolving common issues without requiring manual human intervention.
Common Mistakes in Alert Management
Ignoring Alert Noise
Many teams treat high alert volume as an unavoidable part of managing large systems. Over time, this normalized noise causes engineers to ignore critical warnings, leading to missed outages and longer response times.
Over-Alerting Systems
Configuring alerts for every single metric out of caution creates an unusable monitoring environment. If a metric does not require an engineer to take immediate action, it should be tracked on a dashboard rather than sent as an urgent alert.
Poor Threshold Configuration
Setting static, arbitrary thresholds without accounting for natural traffic cycles leads to a constant stream of false positives during peak business hours and missed anomalies during off-peak times.
No Incident Prioritization
Treating all alerts with the same high level of severity makes it incredibly difficult for on-call teams to identify which issues are actually impacting users during a widespread system disruption.
Lack of Automation
Relying entirely on manual processes for alert sorting, ticket routing, and root-cause analysis slows down your incident response and leaves your systems vulnerable to extended downtime.
Best Practices for IT Alert Optimization
1. Set Action-Only Rules   ► Only alert if an engineer must take immediate action.
2. Apply AI-Based Filters  ► Let machine learning handle deduplication and noise.
3. Monitor Key Metrics     ► Focus on user-facing indicators like latency and errors.
4. Clean Up Redundancy     ► Consolidate duplicate alerts across your tool stack.
5. Review and Improve      ► Regularly tune alert rules based on post-incident reviews.
Define Clear Alert Rules
Review your alerting configurations regularly to ensure that every active alert is actionable. If an alert does not require an engineer to log in and fix something immediately, downgrade it to an informational log or a dashboard metric.
Use AI-Based Filtering
Let machine learning models handle the heavy lifting of deduplication and noise reduction. Trusting an intelligent engine to filter out transient spikes keeps your team’s alert queue clean and actionable.
Monitor Business-Critical Metrics
Shift your focus from internal component metrics (like precise CPU percentages) to user-facing health indicators (like API latency, error rates, and successful checkout transactions).
Reduce Redundant Alerts
Consolidate identical alert configurations across your different monitoring tools. Ensure that a single infrastructure event triggers a single clean notification, rather than sending separate messages to multiple channels.
Implement Continuous Improvement
Incorporate alert optimization into your post-incident reviews. If an incident caused a lot of unnecessary noise or featured a delayed notification, use those insights to update your AIOps correlation models right away.
Future of IT Alert Management
[Reactive Operations] ──► [Intelligent AIOps Context] ──► [Fully Autonomous Self-Healing NOC]
Autonomous Operations
The industry is moving toward fully autonomous operations, where the role of the platform shifts from simply alerting engineers to independently managing and resolving common infrastructure issues.
Self-Healing Systems
Future operations pipelines will automatically execute targeted, closed-loop fixes for known issues—such as adjusting load balancer weights or provisioning temporary cloud resources—resolving problems before humans need to step in.
Predictive Alerting
As forecasting models become more sophisticated, AIOps systems will identify and flag complex structural vulnerabilities and resource bottlenecks days before they can cause real-world performance issues.
Generative AI in IT Operations
Generative AI will play a larger role in operations by automatically drafting incident summaries, creating step-by-step troubleshooting guides, and suggesting precise code fixes based on the root cause data it identifies.
Fully Automated NOCs
The traditional Network Operations Center model is evolving. Instead of teams manually watching screens for green and red lights, automated systems will manage routine triage, allowing human engineers to focus on architecture and long-term system resilience.
FAQ Section
1.What is IT alert management?
IT alert management is the operational practice of collecting, filtering, analyzing, and routing notifications generated by monitoring tools. The goal is to ensure that critical infrastructure and application issues are directed to the right engineering teams quickly, while filtering out non-actionable background noise.
2.How does AIOps reduce alert noise?
AIOps platforms use machine learning algorithms to analyze incoming alert streams. By identifying duplicates, filtering out self-healing transient spikes, and grouping related events based on timestamps and system topology, the platform can reduce overall alert volume by up to 90%.
3.What is alert correlation?
Alert correlation is the process of identifying connections between separate alerts across different layers of your infrastructure. For example, if a database failure causes downstream errors across multiple microservices, an AIOps engine recognizes the shared timing and path, combining those related notifications into a single incident.
4.Can AIOps prevent system outages?
Yes. By using predictive anomaly detection models, AIOps platforms identify early indicators of system degradation—such as unusual memory trends or growing queue depths. This gives operations teams the advanced warning they need to fix underlying issues before they turn into major user-facing outages.
5.What tools are used in alert management?
Traditional alert management relies on static infrastructure monitors, APM tools, and basic on-call routing software. Modern enterprise setups enhance these architectures by adding a centralized AIOps engine like TheAIOps.com to ingest, clean, and analyze data across all those individual tools.
6.How does machine learning help alerts?
Machine learning replaces rigid, manual thresholds with dynamic behavioral baselines that automatically adjust for daily and weekly usage trends. It also helps interpret text logs through natural language processing and automatically groups related incidents based on historical resolution data.
7.What is root cause analysis in AIOps?
Root cause analysis (RCA) in AIOps is the automated process of tracing an incident back through your infrastructure topology to find the original source of the failure. This shows engineers exactly what triggered the downstream cascade, eliminating the need for manual log analysis during an outage.
8.Why is alert fatigue a problem?
Alert fatigue happens when on-call engineers are constantly flooded with non-actionable notifications and false alarms. Over time, this high volume causes burnout and can lead engineers to miss critical, high-priority alerts hidden within the noise.
9.Is AIOps replacing IT engineers?
No. AIOps is designed to support engineering teams, not replace them. By automating routine triage, noise filtering, and root cause analysis, the platform frees human engineers from repetitive tasks so they can focus on high-value design, development, and system optimization.
10.What is the future of IT alert systems?
The future of alert systems lies in fully autonomous, self-healing architectures. Systems will evolve past basic notifications to independently diagnose issues, generate automated fixes, and leverage generative AI to provide clear, real-time documentation throughout the incident lifecycle.
Final Summary
Modern enterprise IT systems are far too complex for manual monitoring and threshold-based alerting models. The sheer volume of telemetry data generated by hybrid cloud environments and microservices often leads to severe alert fatigue, long triage times, and extended system outages that hurt business performance.
AIOps platforms fundamentally change how teams manage infrastructure health. By applying machine learning to the operational lifecycle, platforms like TheAIOps.com automate the heavy lifting of data ingestion, noise deduplication, and event correlation. This turns chaotic waves of raw alerts into clear, actionable incidents complete with automated root-cause analysis.