Upgrade & Secure Your Future with DevOps, SRE, DevSecOps, MLOps!
We spend hours scrolling social media and waste money on things we forget, but won’t spend 30 minutes a day earning certifications that can change our lives.
Master in DevOps, SRE, DevSecOps & MLOps by DevOps School!
Learn from Guru Rajesh Kumar and double your salary in just one year.
Modern enterprise IT environments have grown incredibly complex. The widespread adoption of multi-cloud architectures, microservices, and highly distributed systems has made tracking system health a major challenge. Infrastructure teams are no longer managing a static set of physical servers. Instead, they handle dynamic cloud resources that scale up and down continuously. Enterprise teams need a clear, structured framework to successfully transition to intelligent operations. This comprehensive AIOps implementation guide provides actionable strategies to deploy machine learning models, normalize telemetry data, and automate incident response. By exploring foundational architectures and real-world deployment phases, this guide helps you build a resilient, self-healing production environment. To discover more in-depth strategies, blueprints, and industry trends, explore the comprehensive resources available at TheAIOps.
Key Takeaways
- Data Centralization: Successful platforms rely on a unified data layer that normalizes logs, metrics, and traces across all infrastructure silos.
- Noise Reduction: Advanced event correlation filters out up to 90% of redundant operational alerts by clustering related events into unified incidents.
- Proactive Resolution: Shifting from reactive firefighting to predictive anomaly detection significantly reduces mean time to resolution.
- Phased Rollout: Teams achieve the highest success rates by deploying platforms in incremental phases, starting with high-noise non-production workloads.
What is AIOps?
AIOps stands for Artificial Intelligence for IT Operations. It represents the strategic integration of big data, machine learning, and advanced analytics into modern IT infrastructure management. Instead of relying entirely on manual, human-configured thresholds, these platforms use data science to analyze the massive volume of performance data generated by modern applications. The core goal is to give operations teams intelligent, actionable insights rather than raw, unorganized data. The technology functions as an intelligent central nervous system for your digital infrastructure. Machine learning algorithms excel at analyzing vast data streams in real time. These algorithms establish historical performance baselines for your entire infrastructure stack. Once the system learns what normal behavior looks like, it can instantly spot subtle performance deviations without requiring manual configuration. As your infrastructure grows and evolves, the underlying machine learning models continuously retrain themselves. This automated adaptation ensures that monitoring parameters stay accurate without constant human intervention.
+-----------------------------------------------------------------------+
|                         Unified Data Ingestion                        |
|               (Logs, Metrics, Traces, Events, Topology)               |
+-----------------------------------------------------------------------+
                                    |
                                    v
+-----------------------------------------------------------------------+
|                    AI/ML Analytics & Core Processing                  |
|       (Anomaly Detection, Event Correlation, Pattern Recognition)     |
+-----------------------------------------------------------------------+
                                    |
                                    v
+-----------------------------------------------------------------------+
|                          Actionable Outcomes                          |
|         (Automated RCA, Noise Reduction, Self-Healing Actions)        |
+-----------------------------------------------------------------------+
It is important to understand how this technology relates to observability and DevOps practices. Observability focused on gathering rich telemetry data like logs, metrics, and distributed traces from software systems. DevOps and Site Reliability Engineering practices then establish the organizational workflows and culture needed to act on those insights. Artificial intelligence builds directly on top of these frameworks. It consumes the rich telemetry provided by observability tools and applies machine learning to automate the operational workflows defined by DevOps teams.
Why AIOps Implementation is Important
The sheer scale of modern distributed systems makes manual oversight nearly impossible. When an enterprise application runs across thousands of ephemeral containers and multiple cloud regions, the volume of telemetry data is staggering. Human operators cannot manually track every dependency or correlate performance changes across massive environments. Without automated assistance, tracking down system failures becomes an slow, expensive process of elimination. This structural complexity directly contributes to severe alert overload. Traditional monitoring tools rely on rigid, static thresholds, such as firing an alert whenever CPU utilization exceeds 85%. In a dynamic environment, these rigid rules trigger thousands of daily notifications that do not actually indicate real business impact. This constant noise creates a dangerous environment where on-call engineers become desensitized to notifications. When a truly critical infrastructure failure occurs, it can easily be missed or ignored amidst the flood of minor alerts.
+---------------------------+       +---------------------------+
| Traditional Monitoring    |       | Intelligent AIOps         |
| 1,000+ Disconnected Alerts| ----> | 1 Correlated Incident     |
| (Creates Alert Fatigue)   |       | (Pinpoints Root Cause)    |
+---------------------------+       +---------------------------+
Enterprises desperately need automated systems to protect their engineering velocity and maintain high uptime. When services fail, every minute of downtime directly impacts business revenue and customer trust. Manual incident triage, where engineers from different teams join a temporary war room to find a bug, is too slow for modern digital businesses. By automating data analysis, organizations can instantly correlate events across different layers of the infrastructure stack. This automation shifts operations teams from tedious troubleshooting to fast, targeted incident resolution. Ultimately, this transition delivers a massive reduction in Mean Time to Resolution, or MTTR. By automatically isolating the root cause of an incident, the platform removes the guesswork from troubleshooting. On-call engineers receive a single, highly accurate incident report that explains exactly what went wrong and which services are affected. This precision allows teams to resolve incidents in minutes rather than hours. Over time, it helps organizations move toward self-healing infrastructures that resolve minor anomalies before users ever notice an issue.
Core Pillars of AIOps Implementation
+-------------------+     +-------------------+     +-------------------+
|  Data Ingestion   | --> | Event Correlation | --> | Anomaly Detection |
+-------------------+     +-------------------+     +-------------------+
                                                              |
                                                              v
+-------------------+     +-------------------+     +-------------------+
|    Predictive     | <-- |    Root Cause     | <-- |    Intelligent    |
|     Insights      |     |     Analysis      |     |    Automation     |
+-------------------+     +-------------------+     +-------------------+
Data Ingestion and Normalization
The first foundational pillar is comprehensive data ingestion and normalization. An intelligent operations platform must gather telemetry from every layer of your technology stack. This data includes structured metrics, unstructured log files, network packet traces, and change management events.
Because this data comes from many different vendor tools, it arrives in a wide variety of formats. The ingestion layer standardizes this raw data into a uniform format, ensuring that timestamps, device identifiers, and system attributes match perfectly across all streams.
Event Correlation
Once data is normalized, the event correlation engine analyzes the incoming data streams. This pillar focuses on finding meaningful connections between different events occurring across your infrastructure. For example, if a database performance drop happens at the exact same moment a microservice encounters a spike in network latency, the correlation engine links these events together.
By grouping hundreds of simultaneous, related events into a single operational incident, the platform eliminates redundant notifications and clarifies the overall scope of the issue.
Anomaly Detection
Anomaly detection moves beyond rigid, manual thresholds by using machine learning to track baseline behavior over time. The platform learns the unique performance rhythms of your business, such as natural traffic dips at midnight or predictable database spikes during midday processing.
By understanding these cyclical patterns, the system spots true anomalies, like an unusual rise in error rates on a Tuesday morning, while ignoring normal, expected usage spikes. This dynamic analysis catches emerging threats long before they trigger traditional static alarms.
Root Cause Analysis
Automated root cause analysis helps teams quickly figure out why an issue occurred. When a system failure triggers multiple alerts across your environment, the platform uses topology maps and dependency graphs to trace the issue back to its source.
It evaluates the timeline of events to distinguish between the primary cause of an issue and the secondary symptoms that followed. Instead of just telling you that an application is failing, the system pinpoints the exact misconfigured router or broken database query that started the chain reaction.
Predictive Insights
The final pillar shifts your operational strategy from reactive response to proactive prevention through predictive insights. By analyzing long-term historical data, machine learning models can spot early indicators of future system failure.
The system can warn you if a storage volume is on track to run out of space within three days, or if a memory leak will likely crash a service within twenty-four hours. These early warnings give engineers plenty of time to resolve underlying issues during normal working hours, preventing stressful midnight outages.
AIOps Implementation Architecture
Building a reliable system requires a modular architecture capable of processing massive volumes of data with very low latency. The system must process both real-time data streams and large pools of historical data simultaneously. This dual-processing capability ensures that immediate alerts are handled quickly while machine learning models continue to learn from long-term data trends.
+-----------------------------------------------------------------------+
|                             DATA SOURCES                              |
|   [App Logs]       [System Metrics]       [APM Traces]     [Network]  |
+-----------------------------------------------------------------------+
                                    |
                                    v
+-----------------------------------------------------------------------+
|                           PROCESSING LAYER                            |
|   [Stream Processing (Real-time)]    [Batch Processing (Historical)]  |
+-----------------------------------------------------------------------+
                                    |
                                    v
+-----------------------------------------------------------------------+
|                        ANALYTICS & MACHINE LEARNING                   |
|   [Anomaly Models]    [Correlation Engine]    [Topology Graph Matrix] |
+-----------------------------------------------------------------------+
                                    |
                                    v
+-----------------------------------------------------------------------+
|                    ACTION & INTEGRATION INTERFACE                     |
|   [ITSM (ServiceNow)]   [ChatOps (Slack)]   [Automation (Ansible)]    |
+-----------------------------------------------------------------------+
1. Data Sources
The lowest layer of the architecture consists of your distributed data sources. These sources generate the raw operational data needed to feed the platform. System metrics provide numerical data on resource usage, such as CPU, memory, and disk IOPS. Application logs provide text-based records of software events and errors.
Distributed traces track the paths of user requests as they move through complex microservices, while network data records traffic volumes and packet loss across your infrastructure.
2. Processing Layer
Above the data sources sits the data processing layer. This layer handles data ingestion using two main pipelines: a real-time stream processing pipeline and a batch processing pipeline. The stream processing pipeline handles immediate telemetry data, cleaning and parsing it within milliseconds so the system can spot active incidents right away.
At the same time, the batch processing pipeline moves large sets of historical data into long-term storage, providing the deep history needed to train machine learning models.
3. Machine Learning Models
The machine learning engine acts as the central intelligence of the architecture. It runs multiple specialized algorithms at the same time to analyze your operational data. Anomaly detection models look for unexpected changes in real-time metrics.
Concurrently, natural language processing models read through unstructured log lines to group similar error messages together. This layer also manages a dynamic topology matrix that maps all the dependencies between your hardware, cloud resources, and software services.
4. Event Correlation Engine
The event correlation engine takes the insights discovered by the machine learning layer and groups them into logical incidents. It uses your system topology map to group related alerts based on proximity and time.
For example, if a virtual machine host fails, the engine automatically groups the alerts from the host with the alerts from all the individual containers running on that host. This grouping prevents a single hardware failure from triggering hundreds of separate notifications across different teams.
5. Incident Management Integration
The top layer connects the platform directly to your operational tools and workflows. It integrates with IT Service Management platforms like ServiceNow or Jira Service Desk to automatically log tickets with accurate priority levels.
It also pushes real-time updates to team communication channels like Slack or Microsoft Teams through ChatOps. Finally, it can trigger automated remediation tools like Ansible or automated webhooks to fix common issues automatically, such as restarting a stuck process or clearing a full temporary disk space folder.
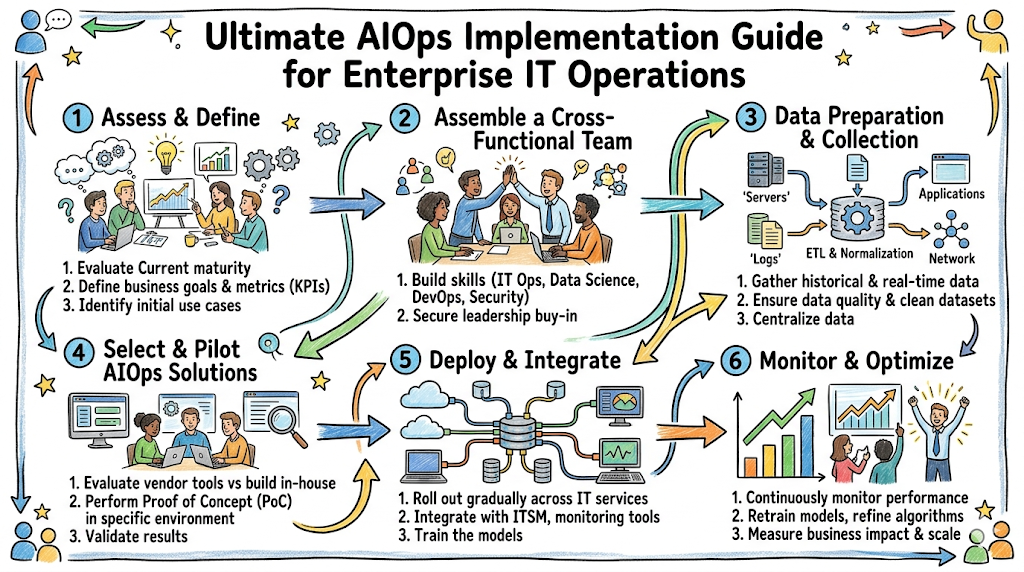
Step-by-Step AIOps Implementation Guide
+-----------------------+     +-----------------------+     +-----------------------+
|        STEP 1         | --> |        STEP 2         | --> |        STEP 3         |
|  Observability Setup  |     | Data Strategy Design  |     |  SLO & KPI Definition |
+-----------------------+     +-----------------------+     +-----------------------+
                                                                        |
                                                                        v
+-----------------------+     +-----------------------+     +-----------------------+
|        STEP 6         | <-- |        STEP 5         | <-- |        STEP 4         |
| Alert Correlation Config|   |  ML Model Training   |     |  Event Normalization  |
+-----------------------+     +-----------------------+     +-----------------------+
            |
            v
+-----------------------+     +-----------------------+
|        STEP 7         | --> |        STEP 8         |
|    RCA Automation     |     | Continuous Tuning     |
+-----------------------+     +-----------------------+
Step 1: Observability Setup
Before implementing artificial intelligence, you must establish a comprehensive observability foundation. This means ensuring your applications and infrastructure are fully instrumented to expose their internal states. Deploy open-source monitoring agents, such as OpenTelemetry, across your entire environment to collect standard metrics, execution logs, and transaction traces.
Without this rich telemetry, your AI engine will lack the data it needs to draw accurate conclusions. Clean, comprehensive data collection at this stage is absolutely essential for avoiding false alarms later on.
Step 2: Data Collection Strategy
With your instrumentation in place, design a scalable data collection strategy to route this massive volume of telemetry data efficiently. Set up secure, centralized data streaming pipelines capable of processing millions of data points per second without slowing down your core applications.
Determine clear data retention policies that balance financial storage costs with the data requirements of your machine learning models. Typically, you should retain high-resolution metrics for at least thirty days to give your algorithms enough historical context to learn baseline behaviors.
Step 3: SLO and KPI Definition
You must translate broad business goals into clear, technical targets by defining Service Level Objectives, or SLOs, and Key Performance Indicators, or KPIs. Focus heavily on metrics that directly track user experience, such as application response latency, request error rates, and overall service availability.
By explicitly feeding these performance metrics into your platform, you teach the AI engine which infrastructure components matter most to your business. This prevents the system from wasting engineering time on minor background anomalies that have no actual impact on your customers.
Step 4: Event Normalization
Configure your ingestion pipeline to parse, clean, and normalize all incoming events into a single, standardized format. This process requires stripping out unneeded text from raw log messages, standardizing timestamp formats across different time zones, and adding clear metadata like environment labels, region codes, and application ownership.
Normalizing your data this way ensures that the correlation engine can accurately compare data points from completely different vendor tools, paving the way for reliable analysis.
Step 5: ML Model Training
Initialize the training phase for your machine learning models using your historical baseline data. Allow the anomaly detection algorithms to run quietly in evaluation mode for several weeks so they can learn the normal operational patterns of your infrastructure.
During this initial learning phase, monitor the models closely to ensure they adapt correctly to typical weekly traffic changes and scheduled maintenance windows. This careful tuning builds a reliable baseline and prevents the platform from triggering a massive wave of false positives when first deployed.
Step 6: Alert Correlation Setup
Configure your event correlation engine to group individual alerts into unified, actionable incidents. Define clear correlation rules based on your infrastructure layout, shared service dependencies, and event timelines.
For example, establish a rule that groups network alerts from a specific switch with performance drops from the servers connected directly to that switch. As the system processes more data, allow its machine learning models to adjust these grouping rules automatically based on historical incident patterns.
Step 7: RCA Automation
Activate automated root cause analysis workflows by linking your correlation engine with live infrastructure dependency maps. Ensure the platform has read-only access to your deployment systems and configuration databases so it can track changes in real time.
When an incident occurs, the system should automatically generate a clear timeline that highlights recent code updates, infrastructure changes, and performance anomalies. This automated timeline shows engineers exactly what triggered the issue, bypassing hours of manual logs analysis.
Step 8: Continuous Optimization
Maintain long-term system accuracy by establishing a regular process for reviewing and optimizing your models. Create a simple feedback loop where your on-call engineering teams can easily rate the accuracy of automated alerts and root cause summaries.
Use this real-world feedback to continuously retrain and fine-tune your machine learning models. Regular optimization ensures the platform evolves alongside your changing infrastructure, preventing configuration drift and keeping alert noise remarkably low.
Event Correlation in AIOps
Event correlation is the process used to turn an overwhelming flood of raw notifications into a small number of clear, actionable incidents. In traditional monitoring setups, a single database failure can cause dozens of individual systems to trigger separate alarms for high application latency, broken API calls, and connection timeouts.
An intelligent platform intercepts this wave of alarms, recognizing that these individual notifications are actually symptoms of a single underlying issue.
+-----------------------------------------------------------------------+
|                           RAW ALERT FLOOD                             |
| [App Timeout]  [DB Latency]  [API Error 500]  [Pod Restart] [Auth Fail]|
+-----------------------------------------------------------------------+
                                    |
                                    v
+-----------------------------------------------------------------------+
|                      DEPENDENCY & TOPOLOGY FILTER                     |
|            (Maps alerts to shared database infrastructure)            |
+-----------------------------------------------------------------------+
|                                   |
|                                   v
+-----------------------------------------------------------------------+
|                       CORRELATED INCIDENT PREVIEW                     |
|  "Incident #402: Database Connection Pool Exhaustion affecting 4 apps"|
+-----------------------------------------------------------------------+
To group these events accurately without relying on fragile, hand-written rules, platforms use topology-aware grouping. This technique utilizes a live map of your entire infrastructure stack, showing exactly how containers, servers, databases, and networks connect to one another.
When multiple systems start failing at the same time, the correlation engine uses this map to trace the dependencies. If five microservices are failing because they all depend on the same back-end database, the platform groups those alerts together automatically.
This intelligent grouping delivers an immediate, massive reduction in alert noise. Instead of waking up an engineer with fifty separate alerts for individual service failures, the platform sends a single consolidated notification. This notification states clearly that a specific database instance is down and lists the five dependent applications currently affected.
By filtering out the noise and presenting a clear picture of the incident, the system helps teams focus instantly on fixing the core problem rather than sorting through repetitive notifications.
AI-Based Root Cause Analysis (RCA)
Finding the root cause of an issue in a modern microservices application can feel like looking for a needle in a haystack. Traditional root cause analysis usually requires assembling multiple teams for an emergency conference call to manually piece together a timeline from disconnected logs.
AI-driven root cause analysis automates this entire process. It analyzes thousands of system events across your infrastructure simultaneously to isolate the exact change or failure that started the incident.
+-----------------------------------------------------------------------+
|                       INCIDENT TIMELINE TRACE                         |
|                                                                       |
|  14:00 -- [Code Deployment V2.1.4]  <-- CRITICAL TRIGGER EVENT        |
|  14:02 -- [DB Connection Leak Detected]                               |
|  14:05 -- [API Gateway Response Latency Spikes]                       |
|  14:06 -- [Frontend User Checkout Timeouts]                           |
+-----------------------------------------------------------------------+
The system achieves this by using advanced pattern recognition algorithms to analyze system dependencies and event timing. It builds a detailed timeline of the incident, working backward from the first user-facing symptom to find the initial failure.
The platform examines recent code changes, infrastructure scaling events, configuration adjustments, and hardware health metrics. By comparing the current incident pattern against years of historical data, it identifies the primary trigger with high statistical confidence.
For example, instead of simply reporting that your user checkout service is slow, an automated root cause summary might state: “Checkout service latency increased by 400% due to database connection exhaustion, triggered by a specific database query optimization introduced in a code deployment ten minutes ago.”
This level of detail changes how teams handle incidents. It gives on-call engineers the exact information they need to fix the issue immediately, such as rolling back the recent deployment, without wasting time on guesswork.
Key Use Cases of AIOps
Cloud Infrastructure Monitoring
In dynamic multi-cloud environments, resource allocation changes constantly as containers spin up and down. Intelligent monitoring systems track these ephemeral resources seamlessly, adjusting their data collection models automatically as the infrastructure shifts.
The platform spots slow, long-term performance degradation across cloud platforms, helps teams optimize infrastructure costs, and identifies orphaned cloud resources that are wasting money.
Application Performance Management
By monitoring application performance data in real time, the platform tracks how users experience your software. It monitors end-to-end transactions across complex microservices, instantly spotting code bottlenecks, unoptimized database queries, and slow third-party API dependencies.
This deep visibility allows development teams to proactively fix performance issues before they impact the broader customer base.
+-----------------------------------------------------------------------+
|                       ENTERPRISE APM USE CASE                        |
|                                                                       |
|  [User Request] --> [API Gateway] --> [Service A] --> [Broken DB]     |
|                                                            |          |
|  AI platform isolates latency directly to Broken DB -------+          |
+-----------------------------------------------------------------------+
Network Operations
Modern corporate networks handle a complex mix of on-premises hardware, remote connections, and cloud networks. AI analytics engines process large volumes of network telemetry data to spot traffic anomalies, predict hardware failures on routers, and locate hidden network bottlenecks.
This helps network teams optimize data routing paths dynamically, ensuring high availability and consistent speed for global applications.
Security Anomaly Detection
Operational telemetry data often contains early indicators of security threats. By analyzing system access logs and network traffic patterns, the platform can spot unusual behaviors that traditional security tools might miss, such as an unexpected bulk data transfer or a sudden wave of login failures from a rare location.
Identifying these anomalies early allows security teams to isolate compromised systems before a full data breach occurs.
DevOps Automation
Integrating intelligent operational data directly into your continuous integration and deployment pipelines creates a powerful feedback loop for development teams. The platform automatically monitors system health during new code rollouts, comparing post-deployment performance directly against historical baselines.
If the system detects a rise in error rates or a memory leak immediately following a release, it can trigger an automated rollback of that deployment, protecting the production environment from unstable code.
Benefits of AIOps Implementation
| Operational Metric | Traditional Management | With AIOps Platform | Business Impact |
| Alert Noise Volume | High (Thousands of daily unlinked alerts) | Low (Correlated into single incidents) | Reduced developer burnout and faster focus |
| Mean Time to Repair (MTTR) | Hours (Requires manual war rooms) | Minutes (Automated root cause isolation) | Maximized application uptime and revenue |
| Operational Stance | Reactive (Firefighting after outages) | Proactive (Predictive anomaly detection) | Issues prevented before users notice |
| System Visibility | Siloed (Separate database, network, app tools) | Unified (Single cross-stack data model) | Clear cross-team collaboration |
Implementing a centralized intelligence platform fundamentally transforms how an enterprise manages its digital services. The most direct benefit is a massive drop in daily alert noise, often filtering out up to 90% of redundant notifications.
By clustering related alerts into a small number of clear, well-documented incidents, the platform saves your engineering teams from constant interruptions. This significant noise reduction protects your engineers from burnout and allows them to focus their energy on building new features rather than triaging false alarms.
In addition to reducing alert noise, the platform drastically accelerates your incident response speed, driving a sharp reduction in MTTR. Because the system automatically isolates the root cause of failures, on-call engineers no longer need to spend hours digging through messy logs or debating which team is responsible for an issue.
Instead, they receive actionable insights right away, allowing them to start fixing the problem immediately. Minimizing downtime this way ensures a highly reliable experience for your users and protects your business from the financial losses associated with service outages.
Challenges in AIOps Implementation
+-----------------------------------------------------------------------+
|                        IMPLEMENTATION BARRIERS                        |
|                                                                       |
|  [Data Quality Gaps] --> Missing context or broken formats            |
|  [Tool Complexity]   --> Integrating legacy monitoring systems         |
|  [Skill Deficits]    --> Team lacks deep data science experience      |
|  [Cultural Inertia]  --> Reluctance to trust automated algorithms      |
+-----------------------------------------------------------------------+
Data Quality Issues
The performance of any machine learning model depends entirely on the quality of the data it consumes. If your core infrastructure components have inconsistent logging formats, missing timestamps, or broken tracking tags, your AI models will struggle to generate accurate insights.
Organizations must invest time upfront in cleaning and standardizing their telemetry data streams. Skipping this step leads to inaccurate models that generate frequent false alarms or miss critical infrastructure failures entirely.
Tool Integration Complexity
Large enterprises typically use a fragmented mix of legacy monitoring tools, specialized cloud services, and custom applications. Getting an AI platform to integrate seamlessly with all these different data sources requires significant engineering effort.
Building and maintaining custom data pipelines and API connections can quickly overwhelm your operations team if not planned carefully. Organizations must choose platforms with broad native integration support to avoid getting bogged down in complex custom development.
Skill Gaps
Deploying and maintaining an intelligent operations platform requires a unique mix of systems engineering, site reliability expertise, and data science knowledge. Many traditional operations teams lack deep experience with machine learning concepts like model training, algorithmic tuning, and data normalization.
Without targeted training or strategic hiring, teams may struggle to configure the platform correctly, leading to underutilized tools and poor automated decisions.
False Positives in ML Models
If a machine learning model is trained on a limited set of historical data, it can easily misinterpret normal operational changes as critical system anomalies. For instance, a harmless seasonal traffic spike during a major holiday sales event could cause an untuned model to trigger a wave of urgent false alarms.
These false positives damage your engineering team’s trust in the platform. Overcoming this challenge requires an ongoing commitment to fine-tuning your models and validating alerts against real-world operational context.
Cultural Resistance
One of the biggest hurdles to adopting automation is building trust within your existing engineering organization. System administrators and SREs are often hesitant to hand over critical incident triage or automated system recovery to machine learning algorithms. They worry that automated fixes might make an active outage worse.
Overcoming this cultural resistance requires a slow, transparent rollout plan. Teams should start by running the platform in a passive, advisory mode so engineers can verify its accuracy before granting it the power to execute automated changes in production.
Best Practices for AIOps Success
To avoid common deployment pitfalls, organizations should always adopt a phased rollout strategy rather than attempting a high-risk, all-at-once transition. Identify a single, well-defined service or a high-noise non-production environment to serve as your initial pilot project.
Use this limited footprint to test your data pipelines, fine-tune your anomaly detection models, and help your operations team get comfortable with the new platform interface. Success in this initial phase provides a clear, low-risk blueprint that you can confidently scale across the rest of the enterprise.
+----------------------+      +----------------------+      +----------------------+
| Phase 1: Pilot       | ---> | Phase 2: Expand      | ---> | Phase 3: Automate    |
| Single non-prod app  |      | Broad infrastructure |      | Safe auto-healing    |
+----------------------+      +----------------------+      +----------------------+
As you expand the platform across your infrastructure, remain hyper-focused on maintaining high telemetry data quality. Treat your operational data pipeline with the same rigor you apply to your production application code. Regularly audit your systems to ensure new microservices conform to your enterprise logging standards and include accurate topology tags.
Additionally, align your platforms directly with established SRE workflows. Use the platform’s automated insights to track your error budgets, validate your slo parameters, and automate repetitive operational tasks. This tight integration ensures your AI platform serves as a practical asset for your engineering teams, rather than just an extra monitoring dashboard.
Future of AIOps
The field of intelligent IT operations is moving rapidly toward fully autonomous operations. Current platforms focus heavily on analyzing data and assisting human operators with incident triage. The next generation of systems, however, will take on a much more active role. Future infrastructure management tools will operate as self-healing networks that detect, isolate, and remediate complex system failures without requiring any manual human intervention.
+-----------------------------------------------------------------------+
|                       FUTURE AUTONOMOUS LOOPS                         |
|                                                                       |
|  [AI Agent Spies Error] -> [Diagnoses Memory Leak] -> [Hot-Patches]   |
|                                                            |          |
|  Zero human intervention required during the entire cycle -+          |
+-----------------------------------------------------------------------+
A major driver of this shift is the introduction of agentic architectures. Unlike traditional, rigid automation scripts that can only follow pre-written steps, intelligent AI agents can adapt to entirely new infrastructure scenarios. Furthermore, the integration of Large Language Models is changing how engineers interact with infrastructure data. Future systems will allow teams to manage operations using natural language interfaces. An engineer will be able to simply ask, “Why did database latency spike in the European region over the last hour?”
FAQ Section
1.What is AIOps implementation?
AIOps implementation is the process of integrating artificial intelligence and machine learning tools into an organization’s IT operations workflows. It involves connecting various data sources, setting up real-time stream processing, and training machine learning models to detect system anomalies. The ultimate goal is to automate data analysis and streamline incident management across complex infrastructure stacks.
2.How does AIOps reduce MTTR?
AIOps reduces MTTR by automating the slow, manual process of incident triage and troubleshooting. Instead of forcing engineers to manually search through disconnected log files during an outage, the platform uses topology maps to isolate the root cause automatically. This gives on-call teams the exact information they need to fix the issue immediately, cutting resolution times from hours to minutes.
3.What data sources are needed for an AIOps platform?
An AIOps platform requires a comprehensive mix of operational telemetry data to work effectively. This includes application and system metrics, unstructured log files, distributed transaction traces, and network performance data. It also ingests change management events, such as code deployments and infrastructure configuration updates, to easily match performance drops with recent system changes.
4.What is event correlation in AIOps?
Event correlation is an automated process that groups hundreds of simultaneous, related alerts into a single, organized incident report. It uses time-based analysis and infrastructure topology maps to distinguish between the primary cause of an outage and its secondary symptoms. This process filters out up to 90% of redundant notification noise, protecting engineering teams from severe alert fatigue.
5.Can AIOps replace traditional monitoring tools?
AIOps does not replace traditional monitoring tools; instead, it sits on top of them to unify and analyze their data. Traditional monitoring tools are designed to gather raw telemetry data from specific areas, like databases or networks. The AIOps platform collects all this scattered data, normalizes it, and uses machine learning to find meaningful patterns across your entire environment.
6.Is AIOps intended to replace DevOps teams?
No, AIOps does not replace DevOps or SRE teams; it is designed to empower them with better data automation. By taking over repetitive, low-level tasks like log parsing and alert filtering, the platform frees engineers from tedious manual work. This allows your DevOps teams to focus their time on strategic projects, architecture design, and building new software features.
7.What is the role of anomaly detection in IT operations?
Anomaly detection uses machine learning to understand the normal, cyclical performance rhythms of your infrastructure. It continuously tracks metrics like CPU usage or web traffic, establishing a flexible baseline that adapts to natural usage changes. This allows the system to accurately spot true technical failures while completely ignoring harmless, expected usage spikes.
8.What are the main challenges when deploying AIOps?
The most common challenges include cleaning poor-quality telemetry data, integrating the platform with complex legacy infrastructure, and overcoming team resistance to automation. Organizations also frequently face skill shortages, as managing these platforms requires a mix of operations expertise and data science knowledge. Planning a gradual, phased rollout helps teams address these challenges safely.
9.How does topology awareness improve root cause analysis?
Topology awareness gives the platform a live, detailed map of all the connections and dependencies across your infrastructure stack. When an outage occurs, the system uses this map to trace how a failure in one component impacts other connected systems. This structural insight allows the AI to accurately separate the root cause from secondary issues, making troubleshooting much more precise.
10.What does the future look like for AIOps systems?
The future is moving toward completely autonomous operations driven by intelligent AI agents and self-healing systems. Future platforms will not only identify infrastructure problems but also independently write, test, and execute code patches to fix outages automatically. The integration of Large Language Models will also allow teams to monitor and manage complex systems using simple, natural language commands.
Conclusion
Transitioning to intelligent IT operations has become essential for enterprises managing highly complex, modern cloud environments. Traditional, manual monitoring simply cannot keep pace with the massive scale of distributed microservices and the constant alert noise they generate. Implementing a centralized analytics platform allows organizations to break down data silos and turn overwhelming numbers of notifications into clear, actionable insights. This shift protects engineering teams from alert fatigue and ensures consistent application performance.