Upgrade & Secure Your Future with DevOps, SRE, DevSecOps, MLOps!
We spend hours scrolling social media and waste money on things we forget, but won’t spend 30 minutes a day earning certifications that can change our lives.
Master in DevOps, SRE, DevSecOps & MLOps by DevOps School!
Learn from Guru Rajesh Kumar and double your salary in just one year.
Introduction
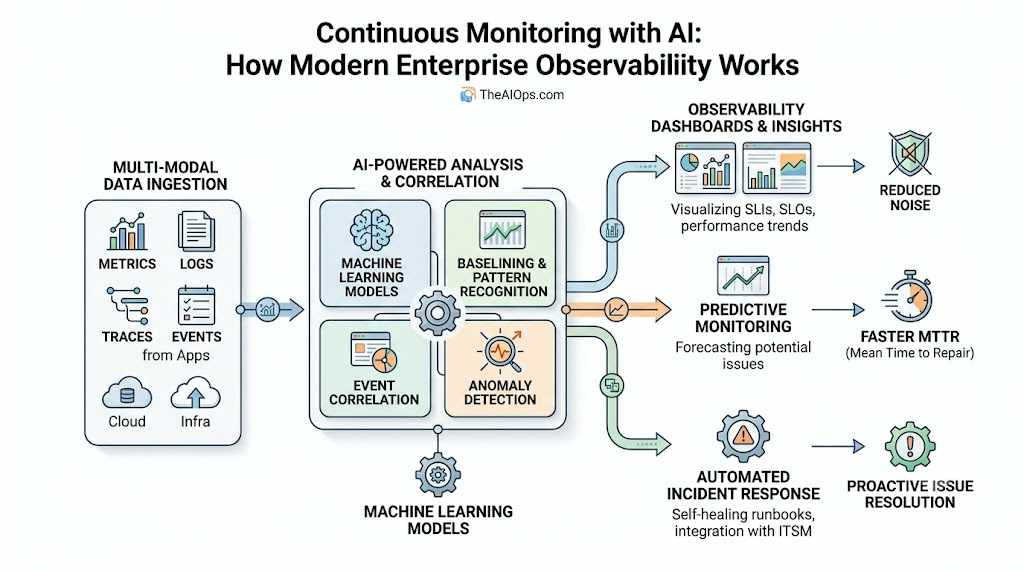
Modern IT infrastructure is undergoing an unprecedented expansion. Multi-cloud architectures, microservices, containerization with Kubernetes, serverless paradigms, and distributed API ecosystems have created systems so dynamic that traditional IT operations methodologies can no longer keep pace. For DevOps engineers, Site Reliability Engineers (SREs), cloud architects, and IT managers, maintaining system uptime and operational resilience feels like attempting to solve a multi-dimensional puzzle that changes shape every second. In this hyper-complex environment, classical static monitoring tools fall short. They bombard operations teams with thousands of disconnected alerts, creating severe “alert fatigue” while hiding the true root cause of outages under a mountain of noise. This is where continuous monitoring powered by Artificial Intelligence for IT Operations (AIOps) becomes essential. At TheAIOps.com, an educational platform dedicated to advancing knowledge in AIOps, observability, DevOps, and cloud automation, continuous monitoring is explained not as a single tool or a static dashboard, but as an intelligent, automated, and continuous feedback loop.
What is Continuous Monitoring?
Continuous Monitoring is the automated process of constantly tracking, analyzing, and logging the health, performance, security, and operational state of IT infrastructure, applications, network resources, and cloud environments across the entire software development life cycle (SDLC) and production runtime.
Unlike periodic health checks or static sampling, continuous monitoring operates in real time. It ingests an uninterrupted stream of operational signals to answer three fundamental questions:
- Is the system operating as expected right now?
- Where are performance degradation or potential failures developing?
- How does an isolated operational change affect the ecosystem as a whole?
In modern software engineering, continuous monitoring forms the foundational feedback loop in Continuous Integration and Continuous Deployment (CI/CD) pipelines and SRE practices. It connects deployment actions directly with real-world operational health.
Why Continuous Monitoring is Essential in Modern IT
The transition from monolithic applications running on physical bare-metal servers to distributed, ephemeral, and cloud-native systems has altered the nature of IT failures.
+-----------------------------------------------------------------------------------+
|                        MODERN DISTRIBUTED ECOSYSTEM                               |
|                                                                                   |
|  [ Microservices ] <---> [ K8s Pods ] <---> [ Serverless Lambdas ] <---> [ DB ]   |
|         |                     |                      |                    |       |
|         v                     v                      v                    v       |
|  +-----------------------------------------------------------------------------+  |
|  |             Uninterrupted High-Velocity Telemetry Stream                   |  |
|  +-----------------------------------------------------------------------------+  |
|                                       |                                           |
|                                       v                                           |
|  +-----------------------------------------------------------------------------+  |
|  |                    AI-Powered Continuous Monitoring                         |  |
|  |   - Multi-Signal Aggregation   - Dynamic Baselining   - Anomaly Detection   |  |
|  +-----------------------------------------------------------------------------+  |
|                                       |                                           |
|                                       v                                           |
|  +-----------------------------------------------------------------------------+  |
|  |                 Automated Remediation & Preventive Action                  |  |
|  +-----------------------------------------------------------------------------+  |
+-----------------------------------------------------------------------------------+
Modern infrastructure poses several distinct challenges that make continuous monitoring vital:
- Ephemeral Micro-Resources: Containers and serverless functions spin up and spin down in seconds. Manual configuration of monitoring agents is impossible.
- Volume, Velocity, and Variety of Telemetry Data: Modern systems produce gigabytes of operational data every minute across logs, metrics, events, and traces.
- Cascading System Dependencies: A minor latency spike in an upstream authentication service can cascade into severe database connection timeouts across multiple downstream services.
- High Cost of Downtime: For modern enterprises, minute-by-minute service disruption translates directly into lost revenue, compliance penalties, and brand erosion.
Without continuous visibility, operations teams remain blind to transient bugs, slow memory leaks, and cascading bottlenecks until end-users experience system failure.
Evolution from Traditional Monitoring to AI-Powered Monitoring
To understand the value of AIOps, it helps to examine how operational monitoring has evolved over the past two decades.
  Traditional Monitoring                   Observability                   AI-Powered Monitoring
  ----------------------              -----------------------              ---------------------
  - Threshold-based                   - Telemetry context                  - Machine Learning models
  - Isolated silos                    - "Why is it happening?"             - Predictive analytics
  - "Is the server up?"               - Manual dashboard analysis          - Automated remediation
| Operational Dimension | Traditional Monitoring | Modern Observability | AI-Powered Continuous Monitoring (AIOps) |
| Primary Focus | System availability & uptime (“Is it down?”) | Internal system state (“Why is it failing?”) | Predictive health, business context, & automated resolution |
| Data Types | Basic CPU/Memory metrics, ping checks | Logs, Metrics, Events, Traces (MELT data) | Multi-modal telemetry, topology maps, change logs, CI/CD signals |
| Alert Triggering | Static thresholds (e.g., CPU > 85%) | Query-based dashboards & manual tracing | Dynamic Machine Learning baselines & contextual anomaly detection |
| Problem Analysis | Manual log inspection across team silos | Manual distributed tracing correlation | Automated Root Cause Analysis (RCA) via topology mapping |
| Operational Impact | High alert fatigue, delayed MTTR | High cognitive load on engineers | Suppressed noise, reduced MTTR, proactive issue prevention |
| Automation Level | Manual ticket generation | Semi-automated alerting | Self-healing workflows and agentic incident execution |
Understanding the Role of AIOps in Continuous Monitoring
Artificial Intelligence for IT Operations (AIOps) represents the convergence of Machine Learning (ML), Big Data, and automated workflows designed to solve modern operational complexity.
As explained by TheAIOps.com, AIOps acts as an intelligent cognitive layer operating on top of your telemetry ecosystem. Traditional monitoring tools gather data and wait for static thresholds to be breached. AIOps applies statistical algorithms, pattern recognition, and natural language processing (NLP) to continuously analyze streaming data, learn baseline behavior, detect anomalies, infer cause-and-effect relationships, and automate operational responses.
How AI Collects and Analyzes Operational Data
AI-powered continuous monitoring follows a structured data pipeline that processes raw operational signals into actionable intelligence:
[ Ingestion & Normalization ] --> [ Noise Reduction & Grouping ] --> [ Topology & RCA ] --> [ Automated Action ]
1. Ingestion & Data Normalization
Telemetry data arrives from disparate sources—cloud provider metrics, APM agents, network switches, container runtimes, system logs, and security feeds. AI ingestion layers normalize these unformatted, unstructured inputs into unified time-series streams and structured JSON formats.
2. Signal Filtering & Noise Suppression
Raw monitoring streams are inherently noisy. Machine Learning models filter out redundant ping failures, transient network spikes, and duplicate heartbeat alerts, instantly reducing operational signal noise by 80% to 95%.
3. Contextual Enrichment & Correlation
The AI enriches filtered signals by attaching organizational context—linking server IP addresses to dynamic Kubernetes pods, specific application microservices, deployment pipelines, and business owner teams.
Monitoring Logs, Metrics, Events, and Traces (MELT)
At the heart of AI-driven continuous monitoring is the MELT telemetry framework:
- Metrics (Numerical Telemetry): Time-series numerical values representing system utilization (e.g., CPU load, memory consumption, request latency, network throughput). AI models analyze metrics to build dynamic behavioral baselines.
- Events (State Changes): Discrete point-in-time occurrences within the system (e.g., deployment completion, autoscaling triggers, user logins, configuration adjustments). Events provide vital temporal context during incidents.
- Logs (Textual Records): Immutable, timestamped textual records produced by applications and operating systems. AI uses Natural Language Processing (NLP) and log parsing algorithms (such as Drain or Spell) to cluster millions of log lines into recognizable log templates and flag abnormal error code occurrences.
- Traces (End-to-End Request Paths): Distributed tracing data tracking the end-to-end path of a user request across microservices. AI correlates trace latency spans to identify exact microservice bottlenecks.
Intelligent Event Correlation
In complex distributed architectures, a single database failure can trigger thousands of downstream alerts from dependent application servers, API gateways, and web frontends. This scenario results in an alert storm.
Intelligent Event Correlation uses machine learning to aggregate thousands of raw event alerts into a single, cohesive, high-level Incident Cluster.
                           +--------------------------------------+
                           |      DATABASE CONNECTION FAILURE     |
                           +--------------------------------------+
                                              |
      +---------------------------------------+---------------------------------------+
      |                                       |                                       |
      v                                       v                                       v
[ Alert 101: Web Timeout ]          [ Alert 102: API 500 Error ]            [ Alert 103: Queue Backup ]
      |                                       |                                       |
      +---------------------------------------+---------------------------------------+
                                              |
                                              v
                              +-------------------------------+
                              |    AI EVENT CORRELATION       |
                              |  - Suppresses 1,000+ Noise    |
                              |  - Groups into 1 Incident     |
                              +-------------------------------+
The correlation engine utilizes three analytical methods:
- Temporal Correlation: Identifying events that consistently occur within the same tight time window.
- Topological Correlation: Analyzing physical and logical dependency maps (e.g., container -> host node -> rack switch -> database cluster).
- Pattern Correlation: Learning historical incident signatures to group related alerts based on past failure modes.
AI-Based Anomaly Detection
Traditional monitoring uses static threshold rules, such as:
IF CPU_Usage > 80% FOR 5 minutes THEN Alert
Static rules suffer from two fundamental flaws:
- False Positives: A batch processing job scheduled at 2 AM spiking CPU to 90% triggers an emergency wake-up call for an engineer, even though system performance is entirely normal for that hour.
- False Negatives: A core checkout microservice slowing down by 15% during peak holiday trading hours might keep CPU at 60%—below the threshold—yet cost millions in abandoned shopping carts.
Dynamic Machine Learning Baselines
AI-powered continuous monitoring replaces static rules with dynamic ML baselining algorithms (such as Seasonal ARIMA, Isolation Forests, LSTM Neural Networks, and Prophet models).
  Metric Value
       ^
       |       /--\             /--\             /--\       <- Upper Baseline
       |      /    \           /    \           /    \
       |-----/------\---------/------\---------/------\---- <- Actual Metric
       |    /        \       /        \       /        \
       |   /          \-----/          \-----/          \-- <- Lower Baseline
       +----------------------------------------------------> Time
The AI dynamically calculates acceptable operational boundaries by continually factoring in:
- Hourly, daily, and weekly cyclical patterns.
- Seasonal business events (e.g., Black Friday traffic spikes).
- Dynamic cloud workload autoscaling behaviors.
An alert is raised only when a metric deviates significantly from its predicted contextual baseline.
Predictive Monitoring and Early Issue Detection
The true power of AI-powered continuous monitoring lies in moving from reactive detection to predictive prevention.
By applying time-series forecasting and regression models to streaming metrics, AI can identify subtle signs of system degradation hours before an outage occurs:
- Memory Leak Forecasting: Detecting a steady, fractional increase in heap memory consumption and projecting system failure 6 hours before an Out-Of-Memory (OOM) crash happens.
- Storage Capacity Planning: Tracking disk usage expansion rates relative to database write trends and issuing automated warning tickets prior to volume saturation.
- Network Latency Drift: Spotting minor, persistent degradation in TCP round-trip times before service level objectives (SLOs) are breached.
Automated Root Cause Analysis (RCA)
When an outage occurs, the longest phase of incident response is usually diagnosing what broke and why. Traditional Mean Time to Resolution (MTTR) is dominated by manual troubleshooting, log hunting, and cross-team argument.
AI-driven Continuous Monitoring drastically accelerates MTTR using Automated Root Cause Analysis (RCA).
How AI RCA Works
1. Incident Trigger -> 2. Topology Graph Mapping -> 3. Change Correlation -> 4. Root Cause Hypothesis
- Topology Graph Mapping: The AIOps engine continuously updates an enterprise topology graph mapping every microservice, database, cloud resource, and network link.
- Change Correlation: The AI cross-references the exact moment of anomaly detection against recent system changes (e.g., recent CI/CD code deployments, Terraform infrastructure updates, feature flag toggles, or config adjustments).
- Causal Reasoning: Using graph algorithms (such as Bayesian Networks or Directed Acyclic Graphs), the system traces error propagation backward through service dependencies to pinpoint the exact originating component, line of code, or configuration change.
Self-Healing Infrastructure and Intelligent Automation
Continuous monitoring reaches its highest maturity level when detection leads directly to automated remediation.
Rather than simply paging on-call SREs, AI systems integrate with event-driven automation frameworks (such as Ansible, SaltStack, Kubernetes Operators, or Runbooks) to execute self-healing actions:
- Automated Service Restarts: Clearing unhandled memory lockups by gracefully cycling failed application pods.
- Traffic Rerouting: Dynamically updating load balancer rules to isolate failing multi-region availability zones.
- Automatic Rollbacks: Triggering an automated deployment rollback in Spinnaker or ArgoCD if error rates spike immediately following a canary release.
- Dynamic Resource Provisioning: Automatically expanding container resource limits or spinning up additional cloud compute nodes ahead of predicted workload bursts.
Continuous Monitoring in Hybrid and Multi-Cloud Environments
Modern enterprises rarely operate in a single cloud. Applications span legacy on-premises datacenters, AWS, Microsoft Azure, Google Cloud Platform (GCP), and third-party SaaS APIs.
Hybrid and multi-cloud environments introduce severe visibility gaps:
- Disparate cloud provider native monitoring tools (AWS CloudWatch, Azure Monitor, GCP Cloud Monitoring).
- Network visibility blind spots between on-premises datacenters and public cloud edge locations.
- Differing security, access control, and telemetry standards across environments.
AI-powered continuous monitoring platform architectures solve this by operating as an abstracted observability control plane. AIOps platforms ingest telemetry uniformly across hybrid environments, normalizing multi-cloud data streams into a single glass pane.
Integration with DevOps, SRE, and ITSM Workflows
AI-powered continuous monitoring is not a standalone silo; it integrates directly into established engineering workflows:
+------------------+     +-------------------+     +------------------+     +-------------------+
|  CI/CD Pipelines | --> |  SRE Observability| --> | ITSM Management  | --> | Automated Action  |
|  (Canary Scans)  |     | (SLI/SLO Tracing) |     | (Jira/ServiceNow)|     | (Ansible/K8s)     |
+------------------+     +-------------------+     +------------------+     +-------------------+
1. DevOps Integration
- Continuous Testing: AI monitors continuous deployment releases in staging and canary environments, comparing metric baselines to automatically block buggy code releases before they reach production.
- GitOps Feedback Loops: Providing immediate health feedback directly into developer PRs and Git repositories.
2. SRE Integration
- SLI/SLO Tracking: Automatically calculating Service Level Indicators (SLIs) and monitoring Error Budget burn rates in real time.
- Toil Reduction: Eliminating repetitive manual operational work through intelligent alert grouping and automated runbook execution.
3. ITSM Integration
- Intelligent Ticket Triage: Automatically generating enriched incident tickets in tools like ServiceNow or Jira with full root-cause summaries, system topology snippets, and recommended resolution steps attached.
Popular Continuous Monitoring and AIOps Tools
Selecting the right tooling stack is critical for implementing AI-driven continuous monitoring. Below is an enterprise comparison of leading platforms:
| Tool | Core AI/AIOps Features | Native Integrations | Primary Use Cases | Key Business & Operational Benefits |
| Dynatrace | Davis® AI causation engine, automatic topology mapping, deterministic RCA | AWS, Azure, GCP, Kubernetes, ServiceNow, Jenkins | Enterprise full-stack observability, cloud-native monitoring | Zero-configuration dependency mapping, accurate root cause identification |
| Datadog | Watchdog AI for automated anomaly detection, log pattern clustering, forecasting | 600+ integrations (Cloud providers, Docker, Slack, PagerDuty) | Infrastructure monitoring, APM, log management, security monitoring | Fast time-to-value, unified dashboarding across hybrid estates |
| BigPanda | Open Box AI for event correlation, alert compression, operational change mapping | Splunk, AppDynamics, ServiceNow, Jira, AWS, Datadog | Centralized AIOps incident intelligence for enterprise ITOps | Dramatically reduces alert noise, unifies fragmented monitoring tools |
| PagerDuty AIOps | ML event grouping, noise suppression, automated runbook trigger execution | Slack, Teams, ServiceNow, Datadog, Prometheus, Dynatrace | On-call incident response, alert orchestration, intelligent escalation | Faster incident triage, prevents on-call engineer burnout |
| Splunk ITSI | Predictive analytics, service health scoring, machine-learning-based anomaly detection | AWS, Cisco, VMware, ServiceNow, Kafka, Azure | Enterprise log analytics, ITOps service intelligence, security operations | Deep log search capabilities combined with predictive health scoring |
| New Relic | Applied Intelligence for anomaly detection, incident correlation, latency analysis | Kubernetes, Terraform, AWS, GitHub, PagerDuty | Full-stack observability, developer performance tracking | Consumption-based pricing, deep application performance visibility |
Real-World Enterprise Use Cases
Case Study 1: Global E-Commerce Retailer During Peak Sales Events
- Challenge: A high-volume online retailer experienced intermittent checkout failures during high-traffic promotional events, resulting in revenue loss.
- AIOps Solution: The enterprise deployed an AI-powered continuous monitoring platform that correlated APM trace spikes with database connection pool limits and recent microservice canary deployments.
- Outcome: The AI identified a newly deployed API microservice leaking database connections, triggered an automated rollback within 90 seconds, and prevented an estimated $1.2M in abandoned shopping carts.
Case Study 2: Financial Services Multi-Cloud Architecture
- Challenge: A major bank managing hybrid infrastructure across on-premises datacenters and AWS suffered from severe alert fatigue, receiving over 45,000 unhandled alerts weekly.
- AIOps Solution: Implementing an AI correlation engine enabled automated filtering and topology-based alert grouping.
- Outcome: Weekly alert volume dropped by 92%, MTTR decreased from 110 minutes to 14 minutes, and the operations team shifted focus from reactive firefighting to proactive SRE engineering.
Business Benefits of AI-Powered Continuous Monitoring
                  +----------------------------------------------+
                  |  BUSINESS VALUE OF AI CONTINUOUS MONITORING  |
                  +----------------------------------------------+
                                         |
     +-------------------+---------------+---------------+-------------------+
     |                   |                               |                   |
     v                   v                               v                   v
[ Reduced MTTR ]   [ Noise Reduction ]           [ Proactive Uptime ]   [ Cost Optimization ]
  (Fast Triage)     (Up to 95% Less)              (Prevents Outages)    (Right-sizing Cloud)
- Drastic Reduction in Mean Time to Resolution (MTTR): By automating anomaly detection, event correlation, and root-cause analysis, teams reduce troubleshooting times from hours to minutes.
- Elimination of Alert Fatigue: Operations teams focus exclusively on high-priority actionable incidents rather than thousands of raw, low-level alerts.
- Prevention of Unplanned Downtime: Predictive monitoring identifies capacity limits and system degradation early, allowing maintenance before customer failure occurs.
- Cloud Infrastructure Cost Optimization: Continuous AI tracking highlights underutilized cloud compute instances, abandoned storage volumes, and memory inefficiencies.
- Enhanced Customer Experience (CX): Seamless, reliable digital service delivery ensures high user satisfaction and protects enterprise brand reputation.
Common Challenges and Limitations
While AI-powered continuous monitoring offers immense value, organizations must overcome specific adoption hurdles:
- Data Quality and Siloed Telemetry: AI algorithms rely on high-quality input data. Incomplete logs, missing timestamps, or fragmented telemetry silos compromise ML model accuracy.
- “Black Box” Algorithmic Distrust: Operations teams may hesitate to trust AI recommendations or automated remediation actions if the underlying causal logic is unclear.
- Initial Setup & Model Training Periods: Machine learning baselines require time to observe system behavior and adjust to weekly traffic patterns before reaching optimal accuracy.
- Cultural Resistance: Moving from manual operational control to automated, AI-driven operations requires cultural transformation across engineering teams.
Best Practices Recommended by TheAIOps.com Experts
To maximize the value of your AIOps investment, TheAIOps.com recommends adhering to the following strategic implementation framework:
- Start with Data Quality First: Clean, standardize, and normalize your MELT telemetry data across all services before enabling AI models.
- Prioritize Event Correlation Over Full Automation: Begin your AIOps journey by deploying ML for alert noise reduction and event correlation. Establish confidence in AI insights before enabling automated self-healing runbooks.
- Maintain Human-in-the-Loop (HITL) Controls: For complex remediation actions (such as database failovers or infrastructure modifications), keep a human approval step in place until model accuracy is validated.
- Unify Monitoring Around Topology: Ensure your AIOps engine integrates dynamic service-dependency mapping; without topology context, root-cause analysis loses precision.
- Establish Clear SLO/SLI Metrics: Align AI monitoring alerting parameters with business-critical Service Level Objectives rather than raw infrastructure utilization rates.
Common Implementation Mistakes to Avoid
- Mistake 1: Treating AIOps as a Replacement for Good Architecture. AI monitoring cannot fix fundamentally flawed, unstable application code or fragile infrastructure design.
- Mistake 2: Buying Tools Without Cultural Alignment. Implementing an expensive AIOps platform without training DevOps and SRE teams leads to low adoption and unused software.
- Mistake 3: Turning On Automated Remediation Too Fast. Enabling unvalidated automated self-healing scripts can cause unexpected cascading issues across production environments.
- Mistake 4: Overlooking Security and Compliance Data. Failing to scrub sensitive Personally Identifiable Information (PII) from application logs before streaming them to cloud-based AI analytics platforms risks severe regulatory compliance violations.
Skills Required for Modern IT Operations Professionals
The shift toward AI-powered continuous monitoring is reshaping career requirements for IT engineers. Modern SREs and DevOps engineers must develop a hybrid skill set:
                  +------------------------------------------+
                  |  THE MODERN AIOPS ENGINEER SKILL MATRIX  |
                  +------------------------------------------+
                                       |
    +------------------+---------------+---------------+------------------+
    |                  |                               |                  |
    v                  v                               v                  v
[ Data & ML Basics ] [ Cloud & K8s Infrastructure ] [ Automation & Code ] [ SRE Observability ]
 (Stats/Python/Data)   (Multi-Cloud/Containers)      (Ansible/Terraform)   (SLOs/Tracing/MELT)
- Data Engineering & Basic ML Literacy: Understanding time-series analysis, statistical distribution, regression models, and data pipeline concepts.
- Infrastructure as Code (IaC) & Cloud Native Architectures: Mastery of Docker, Kubernetes, Terraform, and multi-cloud environments.
- Automation & Scripting: Proficiency in Python, Go, Bash, and event-driven automation frameworks.
- Observability Architecture: Deep understanding of distributed tracing, OpenTelemetry standards, log parsing structures, and metric collection protocols.
- SRE Core Principles: Expertise in error budget management, incident response workflows, post-mortem analysis, and toil reduction strategies.
To help professionals stay ahead of these industry demands, TheAIOps.com offers specialized AIOps Training modules and AIOps Certification preparation guides tailored to real-world engineering environments.
Future Trends in AI-Powered Observability
As artificial intelligence advances rapidly, several emerging trends will shape the future of continuous monitoring:
- Generative AI & Natural Language Querying: Operations teams will interact with monitoring platforms using natural language (e.g., asking “Show me why the checkout service latency spiked after the 2 PM deployment” and receiving immediate text, chart, and code diagnostic summaries).
- Agentic Self-Healing Systems: Autonomous AI agents will move beyond simple script execution to independently diagnose complex multi-system failures, generate and test fixes in isolated staging environments, and execute controlled production remediation.
- OpenTelemetry (OTel) Standardization: OpenTelemetry will become the universal, vendor-neutral standard for collecting and exporting logs, metrics, and traces across all enterprise software stack layers.
- eBPF-Driven Zero-Code Observability: Extended Berkeley Packet Filter (eBPF) technology will enable continuous deep kernel and network-level monitoring without requiring invasive application-level code agents or SDK modifications.
Frequently Asked Questions (10 FAQs)
FAQ 1: What is the main difference between continuous monitoring and traditional monitoring?
Traditional monitoring relies on static rules and manual checks to determine if a component is up or down. Continuous monitoring powered by AI streams real-time telemetry across logs, metrics, events, and traces, using machine learning to detect dynamic anomalies, predict failures, and automate root-cause analysis before outages occur.
FAQ 2: How does AI help eliminate alert fatigue for SRE and DevOps teams?
AI algorithms filter out redundant telemetry noise, suppress duplicate ping alerts, and group thousands of related event signals into a single incident cluster based on temporal and topological correlation. This cuts alert volumes by up to 95%, allowing engineers to focus on high-priority operational issues.
FAQ 3: What is the role of OpenTelemetry in continuous AI monitoring?
OpenTelemetry (OTel) provides a vendor-neutral, standardized framework for collecting, generating, and exporting telemetry data (logs, metrics, and traces). It ensures that AI-powered continuous monitoring engines receive consistent, high-quality data feeds from any cloud or application stack without vendor lock-in.
FAQ 4: Can AI continuous monitoring completely replace human SREs and IT operators?
No. AI is designed to augment human operators, not replace them. While AI excels at processing vast amounts of data, finding pattern anomalies, and automating routine tasks, human expertise remains vital for complex decision-making, architectural design, strategic planning, and handling novel failure scenarios.
FAQ 5: What is dynamic baselining in AIOps monitoring?
Dynamic baselining is an AI technique that uses machine learning to learn normal system performance patterns over time. Instead of relying on rigid, manual thresholds (e.g., alert if CPU > 80%), dynamic baselines continuously adjust limits based on historical trends, time of day, day of week, and seasonal traffic shifts.
FAQ 6: How does AI calculate the root cause of an IT infrastructure outage?
AI platforms combine real-time topology mapping with change correlation and causal graph algorithms. When an anomaly occurs, the engine maps system dependencies, tracks error propagation backward, and cross-references recent code releases or configuration adjustments to identify the exact cause.
FAQ 7: What does self-healing infrastructure mean in the context of continuous monitoring?
Self-healing infrastructure refers to systems that automatically fix detected performance degradation or operational failures without human intervention. When continuous monitoring flags an issue, the AIOps system triggers automated runbooks to restart services, re-route traffic, adjust capacity limits, or roll back faulty deployments.
FAQ 8: Is AI-powered continuous monitoring suitable for small organizations or startups?
Yes. While large enterprises benefit significantly due to their operational complexity, small teams and startups also gain substantial value. AI monitoring allows lean teams to manage expanding cloud infrastructure without hiring large, dedicated 24/7 on-call operations teams.
FAQ 9: What are the risks of enabling fully automated incident remediation?
The main risk is executing incorrect actions due to incomplete system context or unvalidated runbooks, which could trigger secondary failure loops. Organizations should start with Human-in-the-Loop (HITL) approval workflows and thoroughly test automation scripts before granting AI systems autonomous execution permissions.
FAQ 10: How can IT professionals get started with learning AIOps and modern monitoring practices?
Engineers can begin by exploring educational resources on platforms like TheAIOps.com, which offer structured tutorials, tool comparisons, architectural blueprints, and certification preparation guides focused on AIOps, observability, DevOps, and cloud infrastructure automation.
Conclusion
Continuous monitoring powered by Artificial Intelligence is no longer a futuristic luxury—it is a core operational necessity for modern digital enterprises. As cloud architectures grow increasingly complex, dynamic, and distributed, relying on legacy static monitoring tools introduces severe operational risk, extended downtime, and developer burnout. By combining real-time MELT telemetry ingestion, dynamic ML baselining, intelligent event correlation, automated root-cause analysis, and self-healing runbook automation, AIOps transforms IT operations. It enables engineering teams to transition from reactive firefighting to a proactive, resilient operating model built for speed and stability.
