Upgrade & Secure Your Future with DevOps, SRE, DevSecOps, MLOps!
We spend hours scrolling social media and waste money on things we forget, but won’t spend 30 minutes a day earning certifications that can change our lives.
Master in DevOps, SRE, DevSecOps & MLOps by DevOps School!
Learn from Guru Rajesh Kumar and double your salary in just one year.
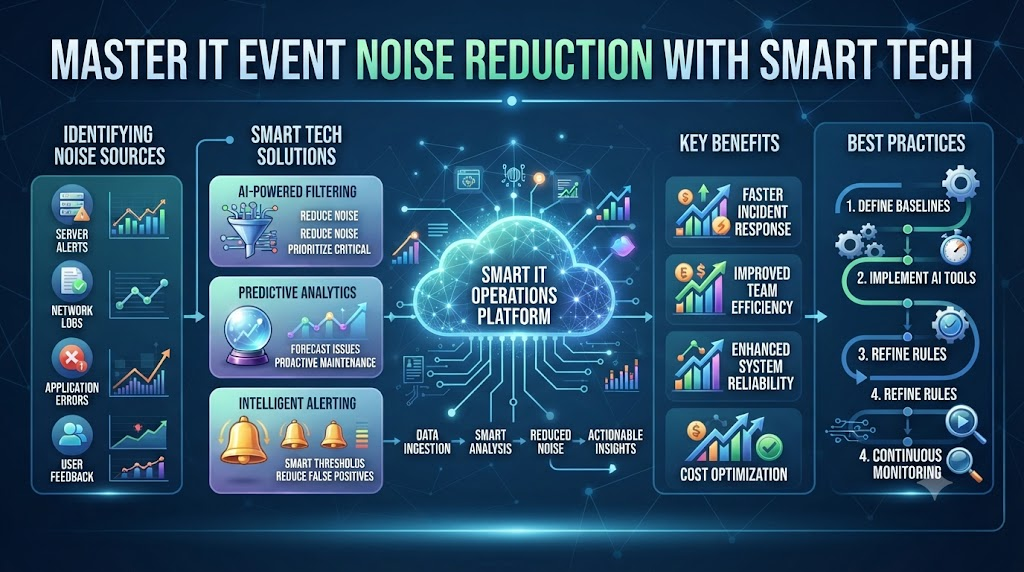
Your phone buzzes at 3:00 AM. You wake up in a panic. You log into your laptop. You check the server dashboard. You see red lights flashing everywhere. You spend the next two hours tracing the issue. Then you find out it was just a minor network glitch. Nothing was broken. No users were hurt. You lost sleep for nothing. This happens every single week.
Your team is drowning in alerts. Every server, router, and cloud app sends a warning message for every tiny change. Most of these messages mean nothing. They are false alarms. This constant flood of noise hides real problems. When a real crisis hits, your team misses it because you are too busy looking at garbage data. You need a way to stop the noise. You need to focus only on what matters.
This is where modern artificial intelligence steps in to help. Tools like TheAIOps change how you handle system alerts. They look at all your data at once. They group related warnings together. They throw away the junk. You get clean insights instead of a wall of noise. Let us look at how you can fix your alert system today.
Why Traditional Monitoring Fails Your Team
Old monitoring tools were built for simpler times. Back then, you had ten servers in a room. If one server stopped, you got one alarm. Today, you run thousands of containers in the cloud. You have microservices talking to each other across the globe. Old tools cannot handle this scale. They treat every tiny blip as a major emergency.
When you get one hundred alerts for one single network hiccup, your brain shuts down. This is called alert fatigue. Your engineers stop trusting the monitoring system. They start ignoring emails and text messages. They might even turn off notifications. This is a huge risk. When a real outage happens, nobody pays attention until customers start calling to complain.
You need to shift your mindset. Do not measure success by how many alerts your system sends. Measure success by how clean your dashboard is. You want zero false alarms. You want every message to tell you something important. When your alerts are accurate, your team wakes up only when real work needs to be done.
The True Cost of Alert Fatigue on Business
Alert fatigue costs real money. Every false alarm pulls your best engineers away from important projects. They stop building new features. They spend their entire day chasing ghosts. They investigate problems that solved themselves five minutes ago. This drains team morale very fast. Good engineers quit when they spend all night fixing fake crises.
Customers also suffer when your team is tired. If your engineers are exhausted from fake night alarms, they make mistakes during the day. A simple software update can go wrong because someone is half asleep. Downtime increases. Customers lose trust in your platform. You lose revenue and market share because your backend systems are noisy and messy.
Fixing this problem protects your bottom line. When you reduce event noise, your engineers stay focused. They work on innovation instead of firefighting. Your systems run smoother. Your customers stay happy. Cleaning up your alerts is not just an IT task. It is a core business strategy that drives growth and keeps your best talent from burning out.
How Machine Learning Cleans Up the Mess
Machine learning changes the game for IT operations. Instead of using rigid rules that trigger alarms based on simple thresholds, smart systems learn normal behavior. They watch your traffic patterns over weeks and months. They know that CPU usage spikes every Monday morning at 9:00 AM. They do not send an alert for this expected behavior.
These smart systems also do event correlation. If a core database goes offline, it might trigger fifty downstream alerts from web servers, load balancers, and payment gateways. An old tool sends fifty separate emails. A smart tool groups all fifty alerts into one single incident ticket. It tells you right away that the database is the root cause. You fix one thing instead of chasing fifty ghosts.
You do not need a degree in data science to use these tools. Modern platforms come with pre-built models. They plug into your existing monitoring stacks like Prometheus, Datadog, or Splunk. They start learning your environment on day one. Within a week, you will see your daily alert volume drop by eighty percent or more.
Real-World Stories About Server Crashes and Noise
- The Midnight Ghost Loop: A retail company suffered a network glitch that caused three hundred servers to spit out memory warnings every ten seconds, waking up the entire on-call rotation for a dead router that rebooted itself successfully in thirty seconds.
- The Payment Gateway False Alarm: A fintech startup had a flaky API connection that triggered high-priority PagerDuty alerts every time a single third-party credit card check failed for half a second, leading engineers to ignore real fraud warnings later that week.
- The Cloud Storage Cascade: An e-commerce platform lost connection to a cloud bucket, generating forty thousand separate error logs within five minutes that completely crashed their internal ticketing system and hid a real database failure.
- The Weekend Backup Storm: A healthcare provider ran weekly database backups that always maxed out disk I/O, triggering automated warning emails to the executive team every single Saturday until they configured smart suppression rules.
- The DNS Flapping Incident: A global media site experienced intermittent DNS packet loss that tripped alerts across twenty different regional teams, causing chaos as engineers tried to fix local servers that were actually healthy.
- The Thermal Sensor Scare: A data room air conditioner flashed a yellow warning light, which an old monitoring tool escalated to a critical red siren, waking up the facility manager for a room that was still running ten degrees below safe limits.
- The SSL Certificate Panic: A small typo in an internal monitoring script made it think public SSL certificates were expiring today instead of next year, flooding the security inbox with urgent tickets during a major product launch.
- The Microservice Echo Chamber: A single broken container in a Kubernetes cluster threw constant timeout errors that echoed through fifty dependent services, creating a massive wave of duplicate alerts that looked like a total system failure.
- The Load Balancer Loop: A misconfigured health check caused a load balancer to ping a healthy web node, mark it dead, revive it, and repeat the cycle every minute, generating endless alert spam all night long.
- The Log Retention Trap: A log server ran out of disk space and sent an alert, but because the alert system itself wrote logs to that same disk, it triggered an infinite loop of alert storms that required manual server reboots.
Comparative Analysis of IT Monitoring Approaches
| Feature | Old Static Thresholds | Modern AIOps Platforms |
| Alert Volume | Extremely high; constant noise | Low; high signal-to-noise ratio |
| Root Cause Analysis | Manual search through raw logs | Automated grouping and tagging |
| Setup Effort | Manual rules for every single metric | Auto-discovery and machine learning |
| False Positive Rate | Up to ninety percent of all alerts | Under five percent after tuning |
| Team Burnout Risk | Very high due to alert fatigue | Low due to focused notifications |
| Adaptability | Breaks when traffic patterns change | Learns and adapts to new baselines |
Common Mistakes and Pitfalls in Alert Management
- Mistake: Setting every single alert to critical priority.Fix: Review your severity levels. Reserve top priority only for total outages that impact paying users right now.
- Mistake: Ignoring alert hygiene for years until the system is unusable.Fix: Schedule a monthly audit where your team reviews every alert rule and deletes any rule that has not caught a real issue in six months.
- Mistake: Creating alerts based on raw server metrics instead of user experience.Fix: Focus on metrics that matter to customers, such as page load speed and checkout success rates, rather than raw CPU load.
- Mistake: Relying on a single person to manage all monitoring configurations.Fix: Distribute ownership. Let each product team manage the alerts for their own microservices using shared templates.
- Mistake: Failing to document what an engineer should do when an alert fires.Fix: Attach a clear runbook link to every single alert notification so the on-call person knows the exact steps to fix it.
- Mistake: Adding new monitoring tools without turning off old duplicate alerts.Fix: Do a full inventory of your tech stack and consolidate all feeds into one single unified event pipeline.
- Mistake: Trusting default vendor alert thresholds out of the box.Fix: Always customize thresholds to match your specific application workload and business hours.
- Mistake: Treating symptoms instead of fixing the underlying code bugs that cause the alerts.Fix: Use alert trends to find repeat offenders in your codebase and fix the root bugs permanently.
- Mistake: Sending all alerts to a public chat channel where everyone ignores them.Fix: Route specific alerts directly to the team responsible for that service using automated on-call schedules.
- Mistake: Never testing your alert pipeline to see if it actually works.Fix: Run regular game days where you simulate failures to verify that your alerts fire correctly and reach the right people.
Step-by-Step Implementation Roadmap
- Audit Your Current Alert Volume: Pull a report of every alert sent over the last thirty days to see which systems generate the most noise and waste the most time.
- Define Clear Severity Levels: Establish strict criteria for what constitutes Info, Warning, Error, and Critical so everyone on your engineering team uses the same definitions.
- Establish Baseline Metrics: Let your monitoring tools run in observation mode for one full week to learn normal traffic patterns and establish accurate baselines.
- Consolidate Event Feeds: Connect all your cloud platforms, server logs, and network monitors into a single centralized event ingestion pipeline to stop data silos.
- Implement Alert Suppression: Set up basic rules to suppress duplicate alerts and silence known maintenance windows so your team stops seeing garbage data.
- Deploy Machine Learning Correlation: Turn on automated event clustering to group related symptoms together and point directly to the root cause of failures.
- Attach Runbooks to Alerts: Update your top twenty most frequent alerts to include direct links to step-by-step troubleshooting guides for the on-call engineer.
- Tune Thresholds and Weights: Review your filtered alerts after two weeks of use and adjust sensitivity settings to eliminate remaining false positives.
- Train Your Engineering Team: Hold a workshop to show your developers and system admins how to use the new streamlined dashboard and incident workflows.
- Review and Iterate Monthly: Set up a recurring monthly meeting to evaluate alert performance, celebrate lower noise levels, and refine your rules further.
1. What is IT event noise reduction?
IT event noise reduction is the practice of filtering out fake, duplicate, or unimportant system alerts so engineers can focus on real problems.
2. Why do monitoring systems generate so much noise?
Old tools use simple static thresholds that trigger warnings for minor traffic spikes, routine maintenance, and harmless background blips.
3. How does machine learning help reduce alert fatigue?
Machine learning models learn normal system baselines over time and group related symptoms together into single, actionable incidents.
4. What is the difference between an alert and an event?
An event is any recorded system occurrence, while an alert is a specific notification sent to a human operator requiring attention.
5. How often should we audit our monitoring alerts?
You should review your alert rules at least once a month to remove dead rules and adjust thresholds for changing workloads.
6. What tools are best for managing IT event noise?
Modern AIOps platforms and unified observability stacks help ingest, correlate, and filter alerts across complex cloud environments.
7. How do runbooks improve incident response times?
Runbooks give on-call engineers instant step-by-step instructions on how to resolve specific alerts without guessing or wasting time.
8. What is alert fatigue and why is it dangerous?
Alert fatigue happens when engineers get too many fake alarms, causing them to ignore notifications and miss real system outages.
9. Should we alert developers about infrastructure issues?
Developers should get alerts tied directly to the microservices and code components they own, rather than generic server hardware metrics.
10. How do I start cleaning up my alerts today?
Start by listing your top ten noisiest alerts from last month, adjusting their thresholds, and turning off any rule that has zero business value.
Final Recommendation and Next Steps
You do not have to live with endless alert noise and exhausted engineers. Fixing your IT event monitoring is one of the highest-return investments you can make this year. Start small by auditing your top ten noisiest alerts this week. Turn off the ones that do not drive action. Connect your data feeds into a modern platform to let machine learning do the heavy lifting.
Take charge of your on-call rotation and give your team the gift of uninterrupted sleep. Visit your monitoring dashboards today, delete the garbage rules, and build a clean, focused system that points you straight to the truth when things go wrong.
