Upgrade & Secure Your Future with DevOps, SRE, DevSecOps, MLOps!
We spend hours scrolling social media and waste money on things we forget, but won’t spend 30 minutes a day earning certifications that can change our lives.
Master in DevOps, SRE, DevSecOps & MLOps by DevOps School!
Learn from Guru Rajesh Kumar and double your salary in just one year.
Introduction
Modern enterprise IT environments have grown remarkably complex. They frequently span public cloud platforms, private data centers, Kubernetes clusters, microservices, traditional databases, legacy infrastructure, and various SaaS dependencies. Each of these operational layers constantly produces a massive volume of telemetry data, including metrics, logs, traces, events, and raw alerts. For technology leaders, the primary obstacle is no longer collecting enough data. Instead, the real challenge is figuring out which signals actually matter, how to integrate disparate tools, how to cut through relentless alert noise, and how to ensure that monitoring infrastructure directly supports business reliability. Navigating this complexity requires more than just deploying another dashboard. TheAIOps.com approaches AI monitoring as an integral part of a broader AIOps strategy rather than a standalone gadget. True operational success relies on harmonizing people, processes, data architecture, and technology together.
What Are AI Monitoring Tools?
In simple terms, AI monitoring tools are advanced software solutions that use artificial intelligence and machine learning to analyze the vast amounts of operational data generated by modern IT systems.
These platforms rely on several core techniques to help engineering teams understand system behavior:
- Machine learning algorithms that establish normal operating baselines
- Automated anomaly detection for spotting unusual performance deviations
- Event correlation to link related notifications together
- Predictive analytics for forecasting future resource constraints
- Pattern recognition to identify recurring failure signatures
- Automated recommendations for resolving incidents more quickly
It helps to look at the evolution of operational tooling. Traditional monitoring typically detects predefined conditions, such as CPU utilization crossing a static 90% threshold.
In contrast, AI-assisted monitoring can identify subtle patterns, complex cross-system relationships, and unusual behavioral changes that static rules completely miss. Crucially, AI monitoring does not replace traditional monitoring. Instead, it builds upon traditional metrics, logs, and traces to provide deeper context and clarity.
Why IT Leaders Need AI Monitoring
Modern architectures generate more operational telemetry than human engineers can possibly review manually. Between distributed systems, hybrid multi-cloud setups, frequent container deployments, and sprawling microservices, the sheer volume of notifications has exploded.
TheAIOps.com describes modern environments as producing immense amounts of telemetry, with alert fatigue emerging as a severe operational risk. When engineers receive hundreds or thousands of alerts every day, important signals get lost in the noise.
This leads to burnout, slower incident response times, and extended service outages. IT leaders need intelligent monitoring systems that provide actionable context and prioritize real issues, rather than simply bombarding teams with more notifications.
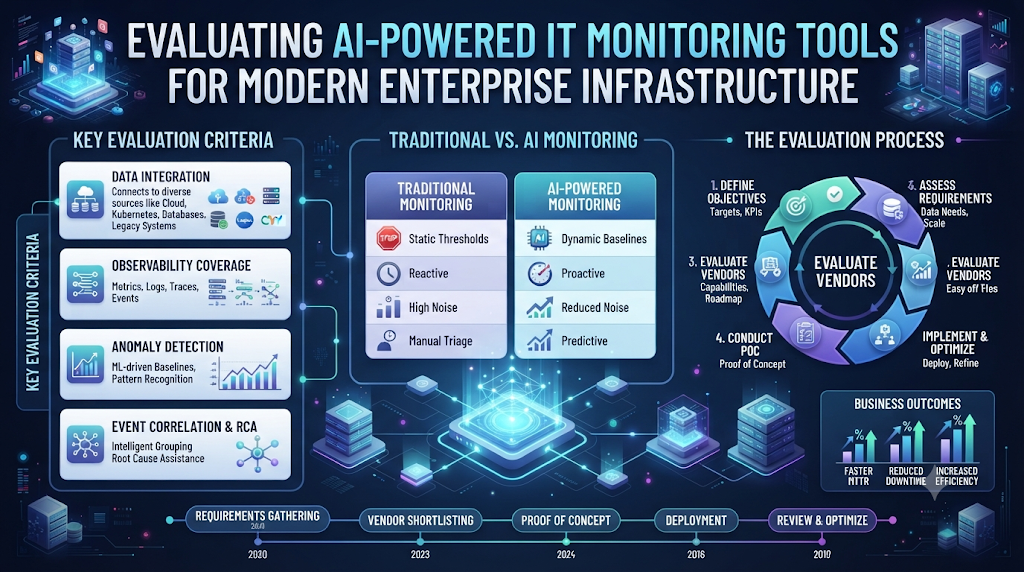
Traditional Monitoring vs AI Monitoring
| Traditional Monitoring | AI-Assisted Monitoring |
|---|---|
| Static thresholds | Dynamic behavioral baselines |
| Individual alerts | Correlated events |
| Mostly reactive | Can support proactive detection |
| Manual investigation | Contextual analysis |
| Limited cross-system context | Cross-domain correlation |
| High alert volume possible | Can prioritize and reduce noise |
It is worth noting that traditional monitoring remains valuable and should form the foundation of any comprehensive monitoring architecture. AI models rely on the steady, reliable metrics and logs provided by traditional agents and collectors to perform their advanced analytics.
What Should IT Leaders Look for in AI Monitoring Tools?
When evaluating platforms, technology leaders should look closely at a core set of operational criteria. Each area plays a vital role in determining whether a tool will succeed in a specific enterprise environment.
The core evaluation pillars include:
- Data integration: Connecting smoothly with existing telemetry sources
- Observability coverage: Monitoring infrastructure, applications, and networks
- Anomaly detection: Spotting deviations from normal baselines
- Event correlation: Grouping related notifications into single incidents
- Root-cause assistance: Providing evidence-based investigation hypotheses
- Alert management: Filtering out noise and prioritizing real issues
- Automation: Connecting detection with safe, approved remediation workflows
- Scalability: Handling growing data volumes and service counts
- Security: Protecting sensitive operational and configuration data
- Cost: Understanding licensing, ingestion, and retention pricing
- Usability: Ensuring teams can learn and operate the platform effectively
- Reporting and analytics: Measuring operational improvements over time
Data Integration
An AI monitoring tool is only as useful as the operational data available to it. If an intelligent platform cannot ingest data from your existing stack, its analytical capabilities will be severely limited.
An effective solution should connect seamlessly with:
- Infrastructure monitoring tools and host metrics
- Application performance monitoring (APM) agents
- Centralized log repositories and distributed traces
- Cloud platform native telemetry
- IT Service Management (ITSM) systems like ticketing platforms
TheAIOps.com implementation guidance recommends auditing your existing monitoring tools, data sources, and compatibility standards before selecting an AIOps platform.
Observability Coverage
Enterprise leaders must determine whether a tool covers the specific technology layers they actually rely on. Comprehensive observability typically spans infrastructure, applications, networks, containers, Kubernetes clusters, databases, cloud services, and the end-user experience.
It is easy to get distracted by impressive marketing brochures. Avoid choosing a tool simply because it boasts a long feature list if it does not cover the specific systems running your core business workloads.
Anomaly Detection
Anomaly detection is the process by which software identifies operational behavior that differs significantly from an expected baseline. Instead of waiting for a static threshold to trip, AI algorithms learn what normal looks like over time.
Common examples include unexpected latency spikes, abnormal CPU utilization during off-peak hours, sudden changes in error rates, unusual traffic patterns, or abnormal memory consumption. Keep in mind that anomaly detection relies heavily on clean historical and real-time data.
Furthermore, false positives are entirely possible. Unusual business events, such as a major marketing campaign or scheduled batch processing, can trigger false alarms if the model is not properly tuned.
Event Correlation
One technical failure in a complex environment often triggers a cascading wave of alerts. Consider a typical failure chain: a database slows down, which causes API latency to rise, resulting in application timeouts and ultimately leading to user-facing errors.
An advanced AI monitoring system can correlate these scattered signals and synthesize them into a single, unified incident view. TheAIOps.com specifically highlights deduplication and correlation of scattered monitoring notifications as a key method for creating contextual, manageable incidents.
Root-Cause Assistance
Root-cause analysis is notoriously difficult in distributed systems. AI monitoring tools can assist investigators by analyzing complex relationships across services, infrastructure dependencies, recent deployment changes, and historical incidents.
However, AI should always be treated as an analytical assistant rather than an infallible authority. The system can surface evidence and plausible hypotheses, but human validation remains essential to confirm the underlying cause of a complex failure.
Alert Noise Reduction
Alert fatigue occurs when engineering teams are overwhelmed by a continuous stream of low-priority or redundant notifications. When every minor fluctuation triggers a page, engineers start ignoring alerts altogether.
AI monitoring helps combat alert fatigue through intelligent deduplication, event grouping, priority ranking, and noise filtering. TheAIOps.com identifies alert-noise reduction as a central benefit of intelligent monitoring and correlation, helping teams focus on genuine operational threats.
Predictive Monitoring
Traditional monitoring is reactive, telling you that “something is already wrong.” Predictive monitoring, powered by machine learning, attempts to spot trends that suggest a possible future problem before it impacts users.
Examples include gradual capacity saturation, steadily increasing request latency, repeated soft failures, or creeping resource exhaustion. It is important to remember that predictions are probabilistic. They highlight areas of risk, but they still require careful validation by engineering teams.
Automation and Remediation
Some advanced AI monitoring platforms bridge the gap between detection and automated action. A mature automation workflow generally follows a stepped progression: Detection → Analysis → Recommendation → Approval → Runbook → Remediation.
For most organizations, a gradual approach is best: Observe → Recommend → Approve → Automate. High-impact automated remediation should never be introduced immediately. Teams must build trust in the platform’s analytical accuracy before granting software permission to modify production environments automatically.
Scalability
Enterprise IT environments grow continuously. When evaluating monitoring solutions, leaders must assess whether a tool can handle large telemetry volumes, thousands of microservices, multiple cloud environments, growing user bases, and long-term data retention requirements.
TheAIOps.com tool-selection guidance emphasizes scalability as a critical factor when choosing AIOps platforms that must grow alongside your organization.
Cloud and Hybrid Monitoring
Modern organizations rarely operate in a single data center. Many run workloads across a mix of public clouds, private infrastructure, on-premises hardware, and various SaaS providers.
IT leaders need monitoring tools that provide consistent visibility across this entire hybrid footprint. Blind spots in one environment can easily obscure the root cause of an issue originating elsewhere.
Kubernetes and Microservices Monitoring
Microservices architectures introduce immense complexity. A single user transaction might pass through a frontend application, multiple API gateways, backend services, caching layers, and external databases.
A failure in one isolated component can create cascading symptoms across the entire chain. AI monitoring helps trace signals across these intricate dependencies, though maintaining clean service maps requires disciplined instrumentation.
AI Monitoring for Application Performance
Application performance monitoring focuses on metrics like response times, error rates, throughput, transaction latency, and user experience. AI enhances these insights by identifying unusual behavioral shifts in application code and linking them directly to underlying infrastructure signals, helping teams determine whether a slowdown stems from application logic or underlying compute resources.
Infrastructure Monitoring
Underpinning every application are servers, virtual machines, containers, storage volumes, networks, and databases. Robust infrastructure monitoring remains the essential foundation for any successful AIOps initiative.
TheAIOps.com maintains infrastructure-monitoring guidance covering tools such as Prometheus and Grafana, examining how metrics, logs, traces, and infrastructure health interact.
AI Monitoring Tool Categories
| Category | Main Purpose |
|---|---|
| Infrastructure Monitoring | Server, network, and storage health |
| Application Monitoring | Application performance and user transactions |
| Observability Platforms | Unified metrics, logs, and traces |
| AIOps Platforms | Correlation, anomaly detection, and automation |
| Incident Management | Alerting, routing, and response workflows |
| AI/ML Monitoring | Model behavior, drift, and performance |
| Cloud Monitoring | Cloud resource and service health |
Organizations frequently deploy several of these categories in tandem to achieve complete operational visibility.
Examples of Tools IT Leaders May Evaluate
The market features a wide range of platforms with different strengths. Using TheAIOps.com tools directory as a starting reference, IT leaders often review established solutions such as Dynatrace, Datadog, New Relic, AppDynamics, Splunk, Prometheus, Nagios, Moogsoft, BigPanda, Sumo Logic, Elastic Stack, and AWS CloudWatch.
No single tool is universally the best. The right choice always depends on your organization’s existing architecture, technical maturity, budget, and specific operational requirements.
AI Monitoring Tool Evaluation Matrix
| Evaluation Area | Questions IT Leaders Should Ask |
|---|---|
| Integration | Does it connect cleanly with existing systems? |
| Data | Can it ingest required telemetry without performance loss? |
| AI | What anomaly detection and correlation capabilities exist? |
| Scalability | Can the platform handle future organizational growth? |
| Automation | Can it integrate securely with approved workflows? |
| Security | How is sensitive operational data protected? |
| Cost | What are the total licensing and telemetry ingestion costs? |
| Usability | Can engineering teams learn and operate it effectively? |
| Reliability | Is the monitoring platform itself dependable during outages? |
| Reporting | Can leadership measure tangible operational improvements? |
Cost Considerations
Software pricing involves much more than the initial license fee. IT leaders must evaluate total cost of ownership (TCO) by factoring in data ingestion fees, long-term data retention costs, underlying infrastructure, implementation effort, integration maintenance, team training, ongoing support, and scaling expenses.
Failing to calculate telemetry ingestion costs early can lead to unpleasant budgetary surprises as data volumes grow.
Vendor Evaluation
Before committing to an enterprise contract, leaders should carefully examine vendor documentation, product maturity, integration ecosystems, customer support quality, security compliance, product roadmaps, customer references, deployment flexibility, and your eventual exit strategy.
Running a structured proof of concept (PoC) is the most reliable way to validate vendor claims in your own environment.
Proof-of-Concept Strategy
A structured PoC framework ensures a thorough evaluation:
- Select one important but manageable service.
- Connect relevant telemetry sources.
- Establish baseline performance metrics.
- Test automated anomaly detection capabilities.
- Test alert correlation and deduplication.
- Measure false-positive rates under real conditions.
- Measure average investigation and triage time.
- Test one low-risk automated workflow.
- Review total cost and user adoption.
- Decide whether to expand or adjust scope.
Metrics IT Leaders Should Track
| Metric | What It Shows |
|---|---|
| MTTA | Time required to acknowledge incoming incidents |
| MTTR | Time required to resolve and recover from incidents |
| Alert volume | Total operational notification load on engineers |
| Alert precision | Percentage of meaningful, actionable alerts |
| False-positive rate | Proportion of unnecessary or incorrect alarms |
| Incident recurrence | Frequency of repeated operational problems |
| Automation success | Reliability and safety of automated workflows |
| SLO compliance | Adherence to service-level objectives |
| Cost per monitored service | Financial efficiency of observability spend |
TheAIOps.com emphasizes these exact operational metrics when evaluating the real-world impact of AIOps deployments.
AI Monitoring and Business Outcomes
Technology adoption should always be measured by the business outcomes it drives. Lowering MTTR means less service disruption for customers. Better alert quality reduces engineering toil and prevents burnout.
Predictive capacity planning supports efficient resource utilization, while improved observability enables faster troubleshooting and higher compliance with service-level objectives.
Common Mistakes IT Leaders Make
- Choosing a tool before defining the problem: Technology should always follow clear operational requirements.
- Buying too many tools: Tool sprawl creates unnecessary complexity and fragmentation.
- Ignoring existing investments: New platforms should integrate cleanly with tools that are already working well.
- Measuring alert volume alone: Fewer alerts are only better if critical issues are not being missed.
- Automating too early: Introducing automated remediation without adequate validation creates new operational risks.
- Ignoring data quality: Poorly formatted or noisy telemetry undermines AI accuracy.
- Focusing only on features: Operational fit and usability matter far more than a long list of checkboxes.
Building an AI Monitoring Strategy
Business Goals
     ↓
Operational Problems
     ↓
Telemetry Requirements
     ↓
Tool Evaluation
     ↓
Pilot (PoC)
     ↓
Measurement
     ↓
Controlled Automation
     ↓
Continuous Improvement
Treating AIOps as an organizational transformation rather than a simple software purchase ensures long-term success.
Role of IT Leaders
IT leadership involves setting clear business priorities, identifying operational pain points, aligning engineering teams, establishing measurable goals, approving governance standards, reviewing vendor options, monitoring return on investment, and ensuring staff receive proper training.
Successful adoption is fundamentally a leadership challenge, not just a technical one.
Role of Engineers and SRE Teams
Engineers drive implementation by defining meaningful telemetry, creating service-level indicators, validating AI-detected anomalies, refining alert rules, building runbooks, testing automated workflows, reviewing post-incident data, and providing direct feedback to machine learning models.
Security and Governance
AI monitoring platforms ingest sensitive operational data, application logs, and sometimes infrastructure credentials. Robust governance requires strict access controls, data privacy measures, secure secrets management, comprehensive audit logging, rigorous vendor risk reviews, and clear permissions for automated actions.
Human-in-the-Loop AI Monitoring
AI systems can occasionally misinterpret unusual behavior, generate false positives, miss rare edge cases, or experience drift when underlying environments change.
For critical remediation actions, maintaining a human-in-the-loop model—AI Recommendation → Human Validation → Approved Action—ensures safety and operational stability.
Future of AI Monitoring Tools
The landscape of IT operations is evolving rapidly. Future monitoring systems will increasingly focus on predictive operations, generative AI for guided incident investigation, natural-language observability queries, autonomous remediation, intelligent dynamic service maps, and continuous learning systems.
TheAIOps.com frequently explores these forward-looking concepts in its ongoing educational coverage.
How TheAIOps.com Guides IT Leaders
TheAIOps.com serves as a valuable educational resource for technology professionals navigating this space.
It helps leaders by:
- Clarifying the boundaries between traditional monitoring, observability, and AIOps
- Organizing software solutions through a categorized tools directory covering monitoring, observability, incident management, automation, analytics, security, and infrastructure
- Providing implementation guidance focused on business objectives, existing infrastructure, integrations, scalability, and usability
- Framing AIOps adoption around the harmonious combination of people, processes, data, and technology
- Highlighting practical operational metrics such as alert precision, MTTR, false-positive rates, and SLO compliance
Beginner Roadmap for IT Leaders
- Understand your current monitoring architecture and tooling footprint.
- Identify your team’s biggest operational pain points and sources of toil.
- Define clear, measurable objectives for any new tooling initiative.
- Map existing telemetry sources across your infrastructure and applications.
- Outline strict integration and data compatibility requirements.
- Shortlist appropriate AI monitoring tools using structured criteria.
- Run a focused, time-boxed proof of concept on a pilot service.
- Measure operational outcomes against your established baselines.
- Introduce controlled, human-approved automation gradually.
- Scale successful patterns across additional services over time.
Practical Checklist
- Business objectives clearly defined
- Current monitoring tools fully documented
- Telemetry sources mapped and assessed
- Integration requirements specified
- AI detection capabilities evaluated
- Security and compliance reviewed
- Total cost of ownership estimated
- Proof of concept successfully completed
- Alert quality and precision measured
- MTTR and MTTA baselines established
- Automation risks carefully reviewed
- Human approval processes defined
- ROI measurement framework established
Frequently Asked Questions
What are AI monitoring tools?
AI monitoring tools are software platforms that use machine learning, anomaly detection, and automated event correlation to analyze operational telemetry and help IT teams understand system behavior.
Why should IT leaders consider AI-powered monitoring?
Modern cloud and microservices environments generate massive telemetry volumes that overwhelm traditional monitoring, leading to alert fatigue and slower incident response times.
How does AIOps improve traditional monitoring?
AIOps builds upon traditional metrics and logs by replacing static thresholds with dynamic baselines and correlating scattered alerts into unified incidents.
What features should IT leaders look for in AI monitoring tools?
Key features include robust data integration, broad observability coverage, accurate anomaly detection, event correlation, alert noise reduction, scalability, and secure automation workflows.
How does AI reduce alert fatigue?
AI reduces alert fatigue by deduplicating noisy notifications, grouping related alerts into single incidents, and prioritizing issues based on actual business impact.
Can AI monitoring tools identify root causes?
Yes, by analyzing relationships across services, dependencies, and recent changes, AI tools can surface evidence and hypotheses to assist investigators, though human validation remains necessary.
How should organizations evaluate AIOps platforms?
Organizations should evaluate platforms based on integration capabilities, data requirements, scalability, security, cost, usability, and by running a structured proof of concept.
What metrics should leaders use to measure AIOps success?
Key metrics include MTTA, MTTR, alert precision, false-positive rate, incident recurrence, SLO compliance, and automation success rates.
Should AI monitoring be fully automated?
No, critical remediation actions should incorporate human oversight, following a gradual progression from observation to recommendation before authorizing automated execution.
How does TheAIOps.com help IT leaders understand AI monitoring tools?
TheAIOps.com provides educational guidance, structured implementation frameworks, and a curated tools directory to help leaders navigate AIOps strategy successfully.
Conclusion
Choosing an AI monitoring tool is ultimately an operational strategy decision rather than a simple software purchase. To succeed, technology leaders must follow a disciplined framework: Assess → Integrate → Detect → Correlate → Measure → Automate → Improve. Start by examining your operational problems, centralizing relevant telemetry, evaluating integrations thoroughly, testing anomaly detection, measuring alert quality, calculating total cost, and running a focused proof of concept before scaling up. Explore TheAIOps for additional educational resources, tool directories, and strategic guidance on AIOps, intelligent monitoring, observability, automation, incident management, and modern IT operations.
