Upgrade & Secure Your Future with DevOps, SRE, DevSecOps, MLOps!
We spend hours scrolling social media and waste money on things we forget, but won’t spend 30 minutes a day earning certifications that can change our lives.
Master in DevOps, SRE, DevSecOps & MLOps by DevOps School!
Learn from Guru Rajesh Kumar and double your salary in just one year.
Introduction
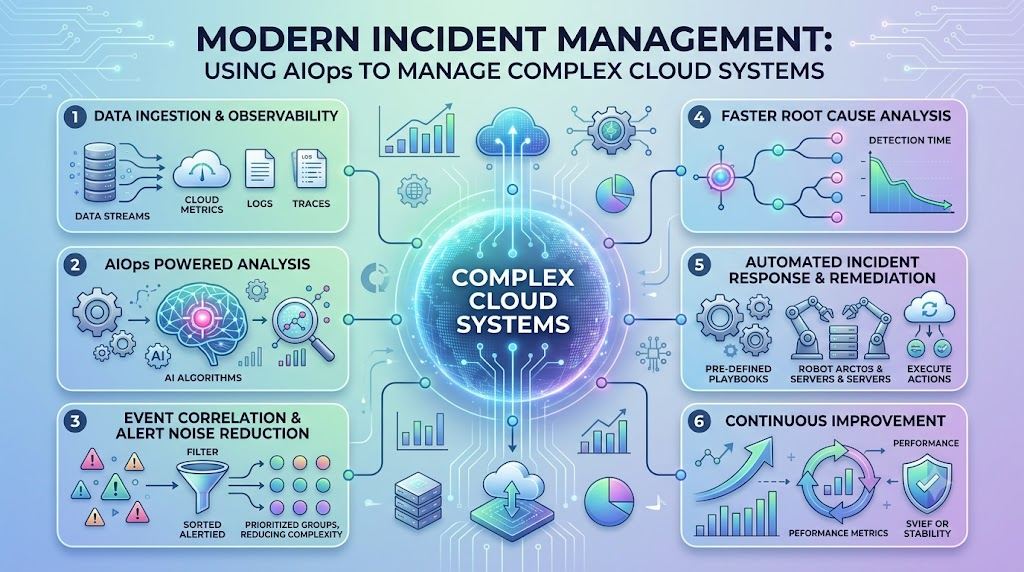
Modern enterprise technology environments are larger, faster, and more distributed than ever before. Organizations rarely run their workloads on a single, centralized set of physical servers. Instead, applications now span multi-cloud platforms, Kubernetes clusters, microservices, on-premises data centers, and third-party APIs. While this distributed architecture delivers speed and scale, it also creates an overwhelming amount of operational overhead. Every layer of the stack produces telemetry data, including metrics, system events, application traces, and server logs. When dependencies are tangled, a minor degradation in a single database or network gateway can trigger hundreds of disconnected alarms across multiple monitoring dashboards. This is where Artificial Intelligence for IT Operations (AIOps) steps in. You can learn more about foundational operational principles directly on TheAIOps.com. AIOps combines machine learning, statistical analysis, big data processing, and automation to help teams make sense of complex operational data. By automatically filtering out noise, correlating related events, pointing to probable root causes, and triggering automated remediations, AIOps transforms reactive fire-fighting into a simplified, proactive operational workflow.
Quick Overview
IT operational complexity is fundamentally a data and dependency problem. When environments grow, the number of alerts increases exponentially while human capacity to process them stays flat. AIOps bridges this operational gap by applying automated intelligence across the incident lifecycle.
| Operational Area | Traditional Approach | AIOps-Driven Approach |
| Data Visibility | Disconnected tools and isolated team dashboards | Ingests metrics, logs, and traces into a single correlated view |
| Alert Management | Static, threshold-based alerts that cause severe alert fatigue | Dynamic baselines that filter false positives and group related events |
| Troubleshooting | Manual war rooms, log grep searches, and guesswork | Automated topology mapping and probable root cause detection |
| Incident Remediation | Manual execution of runbooks and repetitive triage steps | Policy-governed automation and automated self-healing scripts |
| Operational Posture | Reactive fire-fighting after users report service outages | Predictive anomaly detection before business services degrade |
Understanding IT Operational Complexity
Operational complexity does not happen overnight. It develops gradually as organizations modernize infrastructure, adopt new software delivery models, and add specialized monitoring tools to support business growth.
The Breakdown of Traditional Toolchains
Historically, IT teams monitored static environments where applications ran on dedicated virtual machines or physical servers. When an issue occurred, engineers opened the relevant dashboard, identified the offending server, and applied a fix.
Modern architectures do not work this way. Containers appear and disappear in seconds. Serverless functions scale dynamically based on real-time traffic spikes. Ephemeral workloads generate massive volumes of high-cardinality telemetry data. When a failure happens:
- Dependencies are dynamic and difficult to track manually.
- Static alert thresholds trigger thousands of non-actionable notifications.
- Teams waste valuable time arguing over which tier caused the outage.
Core Causes of IT Operational Complexity
Several distinct factors drive complexity in today’s IT organizations:
[Tool Sprawl & Data Silos] ──┐
[Ephemeral Infrastructure] ──┼──> High Alert Noise ──> Slower MTTR & Team Burnout
[Complex Microservices]    ──┘
- Monitoring Tool Sprawl: Enterprises routinely use between 10 and 30 separate monitoring, tracing, and logging platforms across various departments. Because these tools do not share a common context, teams see fragmented views of the same underlying failure.
- Volume and Velocity of Telemetry: Modern cloud environments produce millions of log lines and metric data points per minute. Expecting human engineers to manually parse this stream during a high-severity incident is unrealistic.
- Alert Fatigue and High Signal-to-Noise Ratio: When multiple systems depend on each other, a single upstream issue can trigger a cascade of downstream alerts. Overwhelmed engineers eventually ignore alarms, increasing the risk of missing critical outages.
- Siloed Operational Teams: Networking, database, cloud infrastructure, and software development teams often work in separate systems. Without a single source of operational truth, incident triage frequently devolves into cross-departmental finger-pointing.
How AIOps Reduces Operational Complexity
AIOps addresses operational complexity by acting as an intelligent orchestration and analysis layer across your entire technology stack. Rather than replacing your existing monitoring investments, AIOps platforms ingest, normalize, and analyze the telemetry data those tools already generate.
+-----------------------------------------------------------------------+
|                       Telemetry Data Ingestion                        |
|            (Logs, Metrics, Traces, Events, Topology Maps)             |
+-----------------------------------------------------------------------+
                                   │
                                   ▼
+-----------------------------------------------------------------------+
|                          AIOps Engine Layer                           |
|  * Anomaly Detection       * Event Correlation & Noise Reduction      |
|  * Dynamic Baselines       * Automated Root Cause Identification      |
+-----------------------------------------------------------------------+
                                   │
                                   ▼
+-----------------------------------------------------------------------+
|                          Action & Resolution                          |
|  * Intelligent Prioritization  * Self-Healing & Automated Runbooks    |
+-----------------------------------------------------------------------+
1. Centralizing Data and Providing Unified Visibility
AIOps breaks down operational silos by pulling together metrics, logs, application traces, change events, and configuration management database (CMDB) data into a single analytical layer. This gives engineers real-time visibility across the entire service delivery chain, eliminating the need to log into multiple consoles during an outage.
2. Event Correlation and Alert Noise Reduction
Instead of passing every single alarm directly to on-call engineers, AIOps uses statistical correlation and machine learning algorithms to group related alerts into a single actionable incident. If a storage volume fails, the AIOps platform recognizes that the resulting database timeouts, API error spikes, and application performance degradations all stem from the same event. It bundles those dozens of individual alarms into one consolidated ticket.
3. Dynamic Anomaly Detection
Traditional monitoring relies on hardcoded, static thresholds (such as alerting whenever CPU usage exceeds 85%). This approach creates false alarms during normal traffic spikes and misses subtle degradations that occur below the threshold. AIOps algorithms learn normal operating baselines over time, taking into account time of day, day of the week, and seasonal business cycles. It alerts teams only when behavior genuinely deviates from expected patterns.
4. Automated Root Cause Analysis (RCA)
Finding the origin of a failure across microservices with deep dependency graphs can take hours. AIOps tools combine real-time topology mapping with event causality algorithms to trace an issue backward through the stack. The platform presents engineers with a ranked list of probable root causes along with relevant contextual data, drastically reducing Mean Time to Identify (MTTI).
5. Automated Remediation and Self-Healing
AIOps connects automated insights to execution tools such as Ansible, Terraform, or custom runbook scripts. When the system detects a known, well-understood issue—such as a memory leak requiring a service restart or a disk volume that needs expansion—it can execute pre-approved remediation workflows automatically, resolving incidents before end users are impacted.
Practical Tips for Reducing IT Complexity with AIOps
Implementing AIOps successfully requires a disciplined, step-by-step strategy. Below are practical tips to help you reduce operational overhead while avoiding common implementation pitfalls.
1. Ingest High-Quality Data Before Adding Algorithms
Machine learning models are only as reliable as the data fed into them. If your underlying logs lack standardized formats, or if your metric naming conventions are inconsistent across environments, your AIOps system will generate inaccurate correlations.
- Audit your telemetry data sources before connecting them to an AIOps engine.
- Ensure timestamps across all servers, services, and cloud regions are tightly synchronized via Network Time Protocol (NTP).
- Clean up stale configuration items and inaccurate dependency records in your CMDB.
2. Target Alert Noise Reduction First
Do not attempt full end-to-end autonomous operations on day one. The fastest way to demonstrate value and win buy-in from engineering teams is by eliminating alert fatigue.
- Start by applying AIOps correlation rules to your noisiest infrastructure components.
- Group recurring alerts into single incidents to immediately lower page volume for on-call engineers.
- Measure the drop in overall alert volume to validate that the signal-to-noise ratio is improving.
3. Maintain Accurate Real-Time Topology Maps
Event correlation works best when the system understands which services talk to which databases, queues, and network devices.
- Feed dynamic topology and service dependency maps into your AIOps platform.
- Ensure the platform updates these dependencies automatically as new containers, virtual machines, or cloud resources spin up and down.
- Clear dependency mapping prevents the engine from drawing false correlations between unrelated systems that happen to spike at the same time.
4. Implement Human-in-the-Loop Automation
Handing total control of production remediation over to an AI algorithm right away creates unnecessary risk. Build confidence through progressive automation.
- Configure the AIOps system to recommend specific remediation runbooks without executing them automatically.
- Require an engineer to review the suggested action and click an approval button to execute it.
- Once the team confirms that the suggestions are consistently accurate over several months, enable full self-healing for safe, low-risk operational tasks.
5. Standardize Incident Management Workflows
AIOps is not a substitute for well-structured incident response processes; it is an accelerator for them.
- Integrate your AIOps platform directly with your ticketing systems (such as Jira Service Management or ServiceNow) and communication channels (such as Slack or Microsoft Teams).
- Ensure that correlated incidents automatically generate enriched tickets with logs, traces, and probable causes already attached.
- This eliminates the need for engineers to spend the first 15 minutes of an incident gathering basic diagnostic context.
Practical Examples: AIOps in Action
To understand how AIOps simplifies daily operational work, let us look at two realistic operational scenarios comparing traditional operations with an AIOps-enabled approach.
Scenario A: Resolving an E-Commerce Payment Gateway Degradation
[Database Connection Pool Exhausted]
                   │
         ┌─────────┴─────────┐
         ▼                   ▼
[API Gateway 504 Errors] [Payment Microservice Fails]
         │                   │
         └─────────┬─────────┘
                   ▼
[Static Monitoring: 150+ Alerts] ───VS───> [AIOps: 1 Incident + Root Cause Identified]
Traditional Approach
A sudden database connection pool exhaustion causes an internal payment service to slow down. Within minutes, upstream APIs start timing out, the web checkout microservice returns 504 errors, and synthetic user monitoring fails.
The on-call team receives more than 150 individual alerts across four separate chat channels. Engineers from networking, database administration, and backend application teams join an emergency war room. Each team checks their own monitoring tools, leading to 45 minutes of manual log searching before someone discovers the exhausted database connection pool.
AIOps Approach
The AIOps platform observes the initial database connection saturation alongside the simultaneous rise in API latency and checkout errors. Using topology data, it correlates all 150 incoming alerts into a single incident labeled “Checkout Service Degradation caused by Payment DB Connection Pool Saturation.”
The platform routes a single notification to the on-call database engineer, displays the exact configuration parameter that hit its limit, and provides a direct link to execute an approved connection-pool scaling script. The incident is resolved in less than five minutes with zero cross-team friction.
Scenario B: Catching a Memory Leak After a Minor Deployment
Traditional Approach
A development team rolls out a minor patch to a microservice on a Friday afternoon. The patch introduces a slow memory leak that consumes an extra 2% of RAM every six hours. Because static monitoring thresholds are set to alert only when memory usage crosses 90%, no warnings are triggered over the weekend.
On Monday morning, user traffic surges. The microservice runs out of memory, crashes simultaneously across all instances, and takes down the entire customer portal.
AIOps Approach
Shortly after Friday’s deployment, the AIOps engine’s anomaly detection algorithms notice that the memory consumption curve deviates from its historical baseline for that specific day and time. Even though total memory usage is only at 45%—well below any traditional alarm threshold—the platform flags an abnormal upward trend.
The system flags the issue as a low-priority incident, tags the exact deployment version that introduced the change, and notifies the service owners before they log off for the weekend, preventing a major public outage.
Practical Benefits of Reducing IT Operational Complexity
Simplifying IT operations with AIOps delivers tangible operational and business value across multiple areas:
- Lower Mean Time to Resolution (MTTR): By cutting out the manual work of correlating alerts, searching logs, and identifying dependencies, teams pinpoint and fix issues significantly faster.
- Elimination of Alert Fatigue: Grouping thousands of raw events into a handful of contextual incidents protects engineers from burnout and ensures critical warnings are never missed.
- Lower Operational Overhead: Automating repetitive, tier-1 triage steps frees senior engineers and SREs to focus on architecture, reliability engineering, and shipping product features.
- Proactive Outage Prevention: Machine-learning-based anomaly detection identifies system degradations early, allowing teams to resolve issues before they impact customer experience.
- Better Cross-Team Collaboration: A shared, data-driven view of incidents eliminates organizational silos and reduces friction between development, operations, and security teams.
Challenges and Limitations of AIOps
While AIOps offers significant advantages, it is not a silver bullet. Organizations must be aware of realistic challenges when adopting these platforms.
- Data Quality and Hygiene: AIOps engines depend entirely on accurate data. Inconsistent log schemas, missing metric tags, or outdated network topology maps will lead to poor correlations and misleading recommendations.
- Complex Tool Integrations: Integrating an AIOps platform with legacy on-premises monitoring tools, custom internal applications, and modern cloud services can take significant engineering time.
- Trust and Cultural Adoption: Engineers are often skeptical of machine learning recommendations, especially if the platform operates as a “black box” without explaining why it flagged an issue. Building trust takes time and transparency.
- Risk of Faulty Automations: Triggering automated remediation scripts based on inaccurate root-cause diagnoses can turn a minor service slowdown into a major outage. Automation must be governed with strict guardrails.
- Skills and Operational Maturity Gaps: Successfully managing an AIOps platform requires teams to understand observability concepts, data pipelines, and automation practices. Organizations with low operational maturity may struggle to realize value.
Best Practices for AIOps Success
To get the most out of your AIOps implementation, follow these core operational best practices:
- Define Measurable Goals Early: Establish clear baseline metrics before deploying AIOps. Track specific key performance indicators such as overall alert volume reduction, incident escalation rates, MTTI, and MTTR to measure progress objectively.
- Promote Observability Standards: Standardize structured logging (such as JSON), metric naming conventions, and distributed tracing across all software development teams using open standards like OpenTelemetry.
- Focus on Context Over Raw Data: Do not dump every piece of telemetry into the AIOps engine without structure. Focus on bringing in high-value data that provides clear context regarding service health and user experience.
- Review Machine Learning Accuracy Regularly: Set aside time during post-incident reviews to check whether the AIOps platform accurately identified the root cause. Use those insights to tune correlation rules, suppress edge-case false positives, and improve future accuracy.
- Expand Capabilities Incrementally: Follow a structured maturity path: start with data centralization, progress to noise reduction and correlation, introduce automated root cause analysis, and finally implement automated remediation.
Future Trends in AIOps and IT Operations
As infrastructure and software architectures continue to evolve, AIOps platforms are advancing rapidly in several key areas:
- Integration of Generative AI and Natural Language Interfaces: Modern AIOps tools are incorporating large language models (LLMs) to generate plain-English incident summaries, draft post-mortem reports, and allow engineers to query system status using everyday conversational language.
- Deeper Alignment with OpenTelemetry: The widespread adoption of OpenTelemetry is standardizing how telemetry is collected. This makes it easier for AIOps platforms to ingest consistent metrics, traces, and logs across hybrid-cloud environments without proprietary agents.
- Autonomous Self-Healing at Scale: As trust in AI models grows and guardrail frameworks mature, more organizations will safely move from human-approved remediations to fully autonomous closed-loop healing for common infrastructure failures.
- Shift-Left AIOps: AIOps capabilities are expanding into CI/CD pipelines, analyzing pre-production test runs and staging environments to catch performance anomalies, resource leaks, and misconfigurations before code ever reaches production.
Frequently Asked Questions (FAQs)
1. What does IT operational complexity mean?
IT operational complexity refers to the difficulty of managing, monitoring, and maintaining modern IT systems due to tool sprawl, distributed cloud architectures, massive data volumes, and tangled microservice dependencies.
2. How does AIOps help reduce alert fatigue?
AIOps uses machine learning and event correlation algorithms to analyze incoming alarms in real time, group related events into a single actionable incident, filter out non-critical notifications, and drastically lower raw alert volume.
3. Does AIOps replace existing monitoring tools?
No. AIOps does not replace your monitoring, logging, and tracing tools; rather, it sits on top of them as an intelligent analytics layer, centralizing and correlating the data those tools collect.
4. What is the difference between observability and AIOps?
Observability is the practice of collecting telemetry data—metrics, logs, and traces—to understand the internal state of a system, while AIOps applies machine learning and automation to analyze that data, identify root causes, and resolve issues.
5. Can small IT teams benefit from AIOps?
Yes. While large enterprises deal with higher overall scale, small teams managing complex microservices or cloud infrastructure can use AIOps to automate repetitive triage tasks and handle incidents efficiently without expanding their headcount.
6. What data sources are required for an AIOps platform?
AIOps platforms typically ingest time-series metrics, system and application logs, distributed traces, network flow events, configuration changes, CMDB topology data, and incident records from ticketing systems.
7. How does AIOps perform root cause analysis?
AIOps combines dynamic service topology mapping, temporal analysis, and historical event causality models to trace an incident back through system dependencies and highlight the component most likely responsible for the failure.
8. Is full automation mandatory when implementing AIOps?
No. Organizations should start with read-only visibility, alert noise reduction, and intelligent recommendations before gradually introducing human-approved runbook automations and eventual closed-loop self-healing.
9. What is the most common reason AIOps projects fail?
AIOps projects most frequently struggle due to poor underlying data quality, lack of clear operational objectives, disconnected organizational silos, and attempting complex autonomous remediations before establishing basic event correlation.
10. How does AIOps improve Mean Time to Resolution (MTTR)?
AIOps accelerates MTTR by instantly surfacing the probable root cause, providing engineers with unified operational context, and triggering automated runbooks to resolve known failure patterns without manual delay.
Conclusion
IT operational complexity is an unavoidable byproduct of modern, distributed cloud architectures. As systems scale and the volume of telemetry data grows, relying on manual triage, siloed monitoring tools, and static alerting thresholds inevitably leads to engineer burnout, prolonged downtime, and degraded user experiences. AIOps provides a practical way forward by applying machine learning to ingest disparate operational data, eliminate alert noise, pinpoint root causes, and power intelligent automation. However, achieving these benefits requires a grounded, step-by-step approach.
