Upgrade & Secure Your Future with DevOps, SRE, DevSecOps, MLOps!
We spend hours scrolling social media and waste money on things we forget, but won’t spend 30 minutes a day earning certifications that can change our lives.
Master in DevOps, SRE, DevSecOps & MLOps by DevOps School!
Learn from Guru Rajesh Kumar and double your salary in just one year.
Introduction
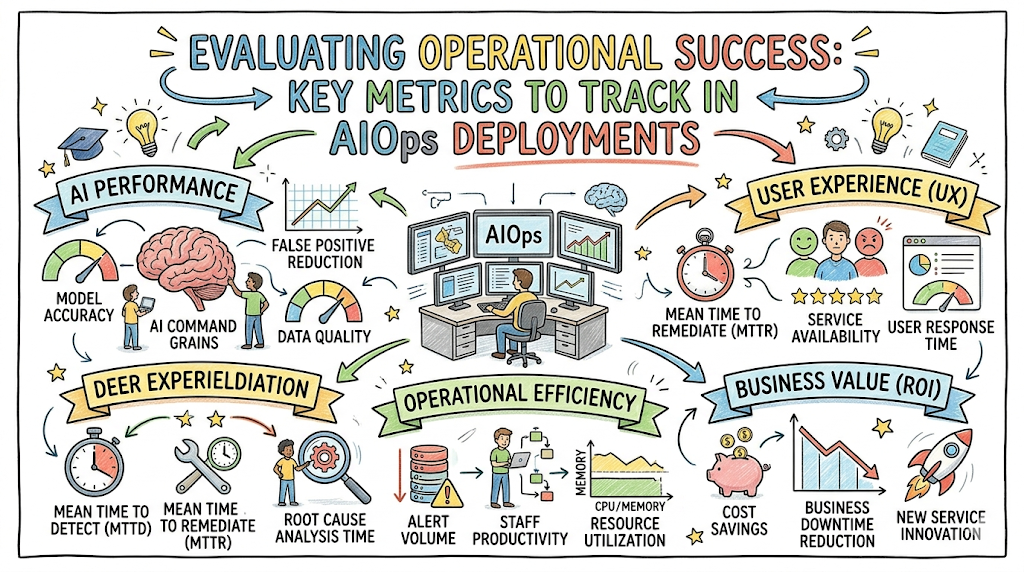
Organizations worldwide are adopting Artificial Intelligence for IT Operations to tame the chaotic sprawl of cloud-native infrastructure, microservices, and hybrid pipelines. Deploying these platforms promises to transform frantic firefighting into calm, predictive operations. However, many infrastructure leaders quickly run into an unexpected roadblock: they struggle to measure whether their new platform is actually delivering value or simply adding another layer of unmapped complexity. Understanding the Key Metrics to Track in AIOps Deployments allows engineering leaders to quantify performance shifts, eliminate alert noise, and justify infrastructure investments. To help teams navigate these complex, data-driven shifts, TheAIOps.com offers real-world reference frameworks and tactical guidance to implement intelligent IT operations. This detailed guide breaks down the essential telemetry, machine learning KPIs, and incident response milestones required to build a highly optimized, modern operations ecosystem.
Understanding Metrics in AIOps Deployments
What are AIOps Metrics?
AIOps metrics are quantitative telemetry readings, statistical indicators, and operational performance values used to measure the health, accuracy, and business value of an AI-powered monitoring platform. Unlike legacy server metrics that only look at static infrastructure utilization (like disk space or memory use), these operational analytics focus heavily on workflow efficiency, machine learning precision, and incident lifecycle trends.
Why Measurement Matters
If you do not measure how your platform operates, you cannot optimize it. Without structured metrics, an engineering group cannot distinguish between a genuine reduction in system failures and a poorly configured model that is simply dropping critical alerts. Measuring platform performance ensures your machine learning algorithms are actively helping your team rather than introducing silent operational risks.
Business and Technical Perspectives
To get a full picture of your infrastructure, you must view your operational metrics through two distinct lenses:
- The Technical Lens: Focuses on telemetry ingestion rates, event correlation efficiency, and anomaly detection accuracy across distributed clusters.
- The Business Lens: Focuses on developer productivity gains, downtime reduction cost savings, and overall user experience stability.
[Technical Telemetry] ---> [ML Processing & Correlation] ---> [Business Outcomes]
(Logs, Metrics, Traces)     (AIOps Platform Performance)       (ROI, Lower MTTR, Uptime)
Relationship Between Metrics and Outcomes
High-quality technical metrics are the foundation for strong business outcomes. For instance, when a system improves its root cause identification rate, it directly lowers the Mean Time to Resolve (MTTR) critical production issues. That technical improvement translates into higher application uptime, protecting company revenue and keeping end-user satisfaction high.
Why Organizations Must Track AIOps Performance
Deploying an intelligent operations tool is a continuous journey of optimization, not a single software installation. Tracking specific performance benchmarks provides critical advantages across your entire technical stack:
- Deep Operational Visibility: Reveals how smoothly data flows across software layers, exposing hidden bottlenecks in your telemetry collection pipelines.
- Continuous System Improvement: Highlights when machine learning models need retraining, preventing operational drift as infrastructure scales up.
- Smart Cost Optimization: Pinpoints underutilized cloud nodes and highlights expensive, noisy applications that generate excessive log volumes.
- Enhanced System Reliability: Helps engineers move from reactive troubleshooting to predictive maintenance, stopping outages before users ever notice them.
- Clear Executive Reporting: Translates confusing technical logs into clean, high-level graphics that demonstrate clear return on investment (ROI) to company leadership.
Core Categories of AIOps Metrics
To measure an enterprise deployment accurately, teams should track metrics across five foundational areas.
Operational Metrics
Operational metrics measure how effectively an organization manages everyday infrastructure incidents.
- Incident Volume: The total number of verified, actionable operational issues escalated to engineering teams.
- Mean Time to Detect (MTTD): The average time it takes for the platform to flag a systemic problem after it starts.
- Mean Time to Resolve (MTTR): The average time required to troubleshoot, fix, and verify an infrastructure issue.
- Alert Volume: The total count of raw alerts produced by underlying monitoring systems before filtering.
- Alert Accuracy: The percentage of generated alerts that point to genuine, actionable production issues.
Reliability Metrics
Reliability metrics evaluate the overall stability and availability of your core business services.
- Service Availability: The proportion of time your core business applications are fully operational for users.
- Uptime Percentage: The total duration that host nodes, clusters, and network pathways remain functional.
- Error Rates: The ratio of failed user requests (like HTTP 5xx responses) to total application traffic.
- SLA Compliance: How consistently your systems meet agreed-upon Service Level Agreements with customers.
Observability Metrics
Observability metrics analyze the depth, volume, and processing efficiency of your system’s data stream.
- Logs Analyzed: The total volume of unstructured log messages ingested and parsed by the platform per second.
- Event Correlation Efficiency: The platform’s ability to compress thousands of raw alerts into single, unified incident timelines.
- Trace Visibility: The percentage of distributed application requests that are fully tracked from end to end.
- Monitoring Coverage: The proportion of active corporate infrastructure being monitored by the platform.
AI and Machine Learning Metrics
These metrics assess the mathematical performance and analytical precision of your underlying algorithms.
- Anomaly Detection Accuracy: How effectively the platform isolates true behavioral outliers from normal traffic spikes.
- False Positives: Instances where the platform mistakenly flags safe, normal system activity as an infrastructure threat.
- False Negatives: Dangerous situations where the platform misses an active infrastructure failure or performance drop.
- Prediction Accuracy: The success rate of predictive analytics engines in forecasting capacity constraints or failures.
- Root Cause Identification Rate: The percentage of incidents where the platform correctly identifies the source of a bug.
Automation Metrics
Automation metrics track how well the platform reduces manual, repetitive engineering workflows.
- Automated Incident Resolution Rate: The percentage of issues fixed by automated runbooks without human help.
- Workflow Execution Success Rate: How reliably automated triggers execute scripts across distributed nodes.
- Automation Coverage: The share of common, repetitive infrastructure issues that have automated fixes.
- Manual Effort Reduction: The total hours saved by engineers after automating tedious infrastructure tasks.
Business Impact Metrics
Business metrics map technical performance gains directly to high-level company goals.
- Cost Savings: The money saved by preventing outages, cutting tool licensing overlap, and optimizing cloud space.
- Productivity Improvement: The extra development hours engineers gain when they spend less time on call.
- Customer Experience Impact: The drop in customer support tickets resulting from a more stable application platform.
- Downtime Reduction: The total decrease in high-severity outages compared to your legacy monitoring era.
Detailed Explanation of the Most Important AIOps KPIs
While tracking diverse telemetry data is valuable, enterprise leaders must focus on five critical Key Performance Indicators (KPIs) to truly evaluate deployment success.
1. Alert Compression Ratio
The Alert Compression Ratio measures how effectively an AIOps platform deduplicates and groups thousands of raw, noisy alerts into a small number of actionable incidents.
$$\text{Alert Compression Ratio} = \frac{\text{Total Raw Alerts} – \text{Total Correlated Incidents}}{\text{Total Raw Alerts}} \times 100$$
This metric is vital because it directly calculates how well the platform stops alert fatigue. For example, if a database failure triggers 1,000 separate alerts across your infrastructure, and the platform groups them into 2 clean incident tickets, you achieve a 99.8% compression ratio. This keeps your on-call engineers focused on the root problem instead of sorting through a wall of duplicate notifications.
2. Mean Time to Inspect (MTTI)
Mean Time to Inspect measures the average time between when an anomaly is first detected and when an engineer or automated system starts actively investigating it.
$$\text{MTTI} = \frac{\sum (\text{Investigation Start Time} – \text{Initial Detection Time})}{\text{Total Number of Incidents}}$$
A low MTTI proves that your alerting pipeline is clean and trustworthy. If engineers trust their notifications, they inspect them immediately. In a large enterprise, dropping average MTTI from 45 minutes to 2 minutes demonstrates that your platform has successfully eliminated confusing false alarms.
3. Noise Reduction Rate
The Noise Reduction Rate tracks the percentage of irrelevant, non-actionable notifications filtered out by your platform’s machine learning models.
$$\text{Noise Reduction Rate} = \frac{\text{False Alarms Filtered}}{\text{Total Alerts Generated}} \times 100$$
High noise values overwhelm operations teams, causing them to miss critical system warnings. A high noise reduction rate ensures that when an engineer receives a notification, it always demands immediate attention.
4. First-Time Resolution (FTR) Rate
The First-Time Resolution Rate measures how often an infrastructure issue is successfully resolved during its initial triage without needing multiple engineering escalations.
$$\text{FTR Rate} = \frac{\text{Incidents Resolved on First Escalation}}{\text{Total Incidents Triaged}} \times 100$$
A high FTR rate proves that your platform’s root cause analysis module provides clear, high-context data right away. If the initial on-call engineer receives the exact logs and code changes responsible for a failure, they can fix it immediately without waking up senior backend developers.
5. Automated Remediation Percentage
This metric measures the proportion of infrastructure incidents that are completely resolved by automated systems without any human intervention.
$$\text{Automated Remediation Percentage} = \frac{\text{Incidents Fixed by Automated Runbooks}}{\text{Total Actionable Incidents}} \times 100$$
This KPI tracks your progress toward building a truly self-healing infrastructure. For example, if a SaaS company handles 500 disk space warnings a month, and an automated system safely clears out temp files to resolve 450 of them, the organization achieves a 90% automated remediation rate for that issue, freeing up significant engineering time.
How to Build an Effective AIOps Metrics Framework
To successfully measure your platform, you need a structured strategy. Avoid turning on all your telemetry tools at once without a clear plan.
Phase 1: Set Clear Operational Objectives
Define exactly what you want your platform to achieve first. Are you trying to cut down on-call stress, reduce system downtime, or optimize cloud costs? Your primary engineering goals dictate which metrics deserve the most attention.
Phase 2: Define Historical Baselines
Before changing your monitoring setup, record your current performance values using your existing tools. Measure your current MTTR, average weekly alert volume, and incident count. These numbers serve as the baseline to prove your platform’s future value.
Phase 3: Establish Tiered KPIs
Organize your metrics into a clear hierarchy tailored for different audiences within the company:
- Tier 1 (Executive): High-level business summaries like total cost savings and overall system availability.
- Tier 2 (Managerial): Team performance metrics like MTTR improvements and automation coverage.
- Tier 3 (Engineering): Deep technical indicators like model false-positive rates and data processing speeds.
Phase 4: Continuous Monitoring and Model Tuning
Review your performance dashboards every week. If you notice your false-positive rates creeping up, it means your infrastructure has changed and your machine learning models need a round of retraining to stay accurate.
Phase 5: Structured Reporting Practices
Share clear, tailored performance summaries with company stakeholders at regular intervals. Keep engineering reviews focused on technical precision, while presenting long-term cost benefits and system stability trends to executive leadership.
Real-World AIOps Measurement Scenarios
Dynamic Cloud Environments
In highly fluid, containerized environments, clusters scale up and down constantly based on consumer demand. A modern platform tracks anomaly detection accuracy alongside these scaling actions, ensuring that normal, rapid container creation is never misclassified as a malicious system attack or resource leak.
Enterprise IT Operations
Large, complex organizations often run an intricate mix of legacy on-premises servers and modern public cloud apps. Their metrics framework focuses heavily on event correlation efficiency, ensuring that errors in legacy database clusters are correctly linked to performance drops in modern frontend APIs.
Modern Banking Systems
Financial platforms operate under strict regulatory uptime rules. Their operations teams focus intensely on predictive analytics metrics, relying on early warnings to spot database capacity limits hours before they can disrupt transaction processing or violate compliance policies.
High-Scale SaaS Platforms
Software providers shipping daily code updates face frequent system changes. They closely monitor trace visibility and log analysis speeds, verifying that new feature rollouts do not introduce silent memory bugs that slow down performance for global users.
Global E-Commerce Infrastructure
Retail platforms experience sudden, massive traffic spikes during seasonal sales events. Their metrics framework prioritizes the alert compression ratio and noise reduction rate, allowing on-call teams to remain focused on actual checkout bugs rather than a flood of expected high-traffic warnings.
Common Mistakes When Tracking AIOps Metrics
- Tracking Too Many Metrics Simultaneously: Trying to monitor hundreds of different values at once creates dashboard confusion. Focus on a core set of actionable indicators that match your immediate business goals.
- Ignoring High-Level Business Outcomes: An engineering team might achieve an exceptional 98% alert compression ratio, but if customer-facing downtime remains unchanged, the deployment is not delivering real business value.
- Focusing Exclusively on Alert Volumes: Simply counting alerts does not tell you if your systems are healthy. A drop in alerts might mean your infrastructure is more stable, or it could mean your monitoring configuration is broken.
- Poor Alignment of Performance KPIs: Measuring your platform with mismatched indicators leads to confusion. Do not evaluate an automated cost-saving tool using strict incident response timelines.
- Operating Without Solid Baseline Measurements: If you fail to record your system performance before deploying your new platform, you will find it impossible to prove how much your operations have improved.
Best Practices for AIOps Performance Measurement
To get the most out of your monitoring investments, follow these industry-standard approaches:
- Align KPIs with Business Values: Ensure every technical metric you track directly supports a business goal, like mapping lower MTTR values to reduced customer churn.
- Optimize Models Continuously: Regularly audit your anomaly detection models to keep them aligned with shifting software behavior and infrastructure updates.
- Design Clean, Scannable Dashboards: Build role-specific views that help engineers track technical anomalies instantly, while giving managers a quick look at long-term reliability trends.
- Deliver Clear Executive Reports: Translate complex technical data into plain English summaries focused on saved engineering hours and protected revenue.
- Prioritize High-Quality Data Ingestion: Maintain clean data standards across your infrastructure; accurate machine learning insights always depend on clean input metrics.
Tools Used for AIOps Metrics and Analytics
Building a robust metrics-driven architecture requires combining specialized tools for data collection, algorithmic processing, and clear visualization.
- Monitoring Platforms: Foundations like Prometheus or OpenTelemetry track raw system metrics, logs, and trace files across your infrastructure.
- Observability Suites: Enterprise platforms like Datadog, Dynatrace, and New Relic process your raw telemetry through out-of-the-box machine learning engines to calculate alert compression and root causes.
- Advanced Analytics Solutions: Big data platforms like Splunk ITSI or Elastic Stack specialize in parsing millions of unstructured log lines to uncover subtle anomaly patterns.
- Dashboard Technologies: Visualization platforms like Grafana or native cloud dashboards turn complex operational metrics into clean, scannable graphs for engineering and leadership teams.
Future of Metrics-Driven AIOps
The field of operational telemetry is moving away from static historical dashboards toward fully proactive, self-optimizing environments.
Shift to Predictive Operations
Future operations platforms will focus almost entirely on predictive metrics. Instead of reviewing charts showing yesterday’s outages, engineering leaders will monitor risk indicators that forecast exactly where infrastructure vulnerabilities are likely to emerge over the coming weeks.
Growth of Autonomous Remediation
As machine learning models become more precise, systems will move beyond simply flagging problems to fixing them automatically. Teams will shift from tracking human incident resolution times to monitoring the speed and safety of autonomous self-healing runbooks.
Frequently Asked Questions
- What is the single most critical metric to track in an AIOps deployment?
While goals vary, Mean Time to Resolve (MTTR) remains the definitive metric for most teams. A successful deployment should visibly drive down MTTR by providing engineers with instant root-cause data and actionable context during an incident.
- How does alert compression directly reduce operational costs?
High alert compression groups thousands of noisy, repetitive notifications into a few clear incident tickets. This saves significant money by preventing engineering teams from wasting hours triaging duplicate alarms on weekends or during off-hours.
- What is a healthy target for an enterprise alert compression ratio?
Mature organizations typically aim for an alert compression ratio between 85% and 95%. Achieving this range ensures that minor, repetitive system alerts are filtered out, leaving teams with clean, actionable notifications.
- How do false positives damage an organization’s infrastructure operations?
High numbers of false positives lead directly to alert fatigue. When engineers are constantly woken up by harmless system blips, they begin to tune out notifications, which often causes them to miss actual, high-severity outages.
- Can business impact metrics be tracked automatically by observability tools?
Some advanced observability platforms can link corporate database metrics (such as completed checkout volumes or payment API drop-offs) directly to technical logs, allowing teams to view real-time business health alongside infrastructure performance.
- How often should machine learning anomaly baselines be updated?
Most platforms update their baseline models automatically on a continuous cycle. However, engineering teams should conduct a manual review of their alert settings every quarter to ensure the models stay aligned with major application rollouts.
- What is the difference between MTTD and MTTI?
Mean Time to Detect (MTTD) measures how long it takes the platform to find an anomaly. Mean Time to Inspect (MTTI) tracks the time it takes for a human engineer or automated script to begin investigating that flagged issue.
- How do you show the return on investment of an AIOps platform to executive leadership?
You can demonstrate clear ROI by showing a steady drop in high-severity outages, calculating the engineering hours saved through automated remediation, and highlighting the revenue protected by preventing system downtime.
- Why is tracking monitoring coverage important for platform engineers?
Monitoring coverage ensures you do not have blind spots in your infrastructure. If a company introduces new cloud clusters or third-party services without installing telemetry agents, the platform cannot analyze that data to spot failures.
- How do automated runbooks improve first-time resolution rates?
Automated runbooks run pre-approved scripts to fix known issues instantly (like restarting a stuck service or clearing space). This resolves the issue immediately on the first alert, preventing the need to escalate the ticket to senior engineering tiers.
Final Summary
Deploying an AI-driven operations platform can transform how your enterprise manages complex infrastructure, but long-term success depends on tracking the right data. By focusing on critical metrics like the alert compression ratio, MTTR, noise reduction, and automated remediation, organizations can eliminate operational blindness and build highly resilient systems. Evaluating and optimizing these metrics is a continuous process that requires a strong blend of technical knowledge and strategic planning.