Upgrade & Secure Your Future with DevOps, SRE, DevSecOps, MLOps!
We spend hours scrolling social media and waste money on things we forget, but won’t spend 30 minutes a day earning certifications that can change our lives.
Master in DevOps, SRE, DevSecOps & MLOps by DevOps School!
Learn from Guru Rajesh Kumar and double your salary in just one year.
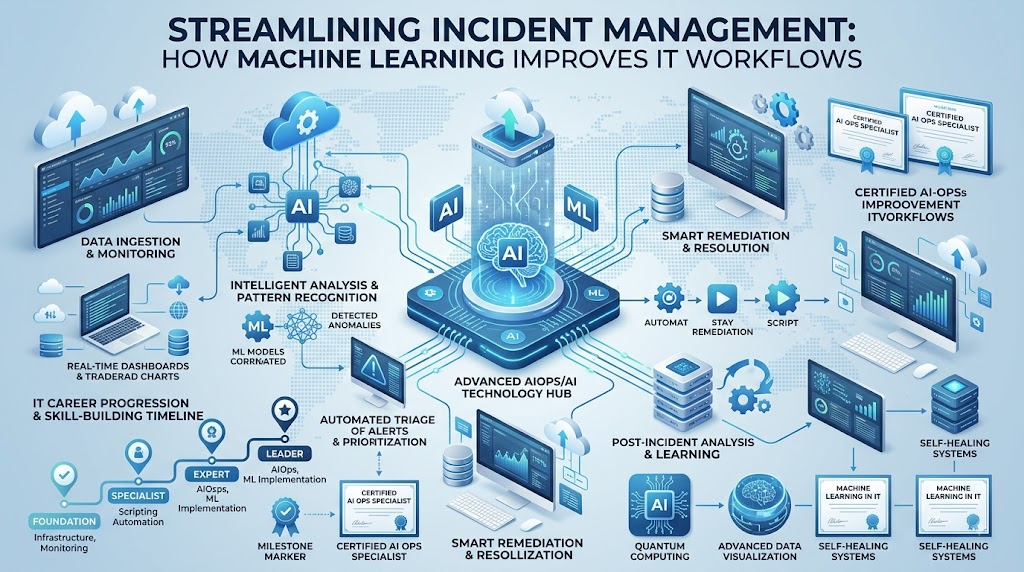
Modern enterprise IT environments generate staggering volumes of telemetry every single minute. Distributed applications running across multi-cloud setups continuously emit gigabytes of logs, millions of performance metrics, constant event notifications, and complex network traces. For operations teams, keeping up with this overwhelming flood of signals using manual review or static, rule-based dashboards has become nearly impossible. This operational complexity is where machine learning for IT workflows becomes valuable. By analyzing telemetry in real time, machine learning algorithms can surface subtle patterns, highlight behavioral anomalies, prioritize urgent alerts, and help automate routine diagnostic tasks. Rather than replacing systems engineers, Site Reliability Engineers (SREs), or IT operations professionals, machine learning acts as an analytical co-pilot that filters noise and provides actionable context. To explore more educational frameworks and architectural guides on modern operations, visit TheAIOps.com. This guide covers how machine learning operates across IT workflows, where it adds measurable value, its real-world limitations, and how teams can adopt it systematically.
What Is Machine Learning in IT Operations?
At its simplest, machine learning (ML) is a branch of computer science where algorithms analyze historical and real-time data to identify patterns, make classifications, or forecast future outcomes without being explicitly programmed with rigid, hardcoded rules.
In day-to-day IT operations, machine learning is applied directly to the continuous operational telemetry generated by computing infrastructure and applications:
$$\text{Operational Telemetry} \longrightarrow \text{ML Analysis} \longrightarrow \text{Pattern Detection} \longrightarrow \text{Operational Insight} \longrightarrow \text{IT Action}$$
Machine learning systems ingest and evaluate several core IT data sources:
- Metrics: Time-series performance measurements such as CPU load, memory saturation, storage I/O, and network bandwidth.
- Logs: Text output generated by applications, servers, databases, and network devices describing operational events.
- Events & Alerts: Structured notifications from monitoring platforms indicating threshold breaches, service status changes, or deployment activities.
- ITSM Tickets: Historical and active service desk tickets containing incident descriptions, resolutions, and categorization tags.
- Application Performance Telemetry: Distributed traces, latency measurements, and transaction error rates.
Rather than relying on magic, ML uses statistical techniques to establish baseline behavior, track variations, and classify incoming telemetry against historical profiles.
What Are IT Workflows?
An IT workflow is an established sequence of procedural steps and actions carried out by operations teams to manage, maintain, or resolve issues within an IT environment.
Common operational workflows include:
- Detecting and categorizing new incidents
- Investigating and triaging system alerts
- Correlating performance degradations with recent deployments
- Escalating complex tickets to secondary engineering tiers
- Executing remediation scripts and verifying operational recovery
- Conducting post-incident retrospectives
[System Alert] ──> [Investigation] ──> [Diagnosis] ──> [Remediation] ──> [Verification]
In traditional operations, each step in this path depends almost entirely on human intervention: an engineer receives an alert, manually queries multiple monitoring dashboards, reads raw log streams, identifies the affected system, writes a diagnostic ticket, and executes a fix.
How Machine Learning Changes IT Workflows
Machine learning transforms manual workflows into data-assisted, proactive operational loops. Instead of waiting for an engineer to notice a spike or cross-reference isolated dashboards, ML models continuously process telemetry in the background to provide timely contextual recommendations.
| Operational Area | Traditional IT Workflow | ML-Assisted IT Workflow |
| Alert Analysis | Evaluates fixed, static thresholds | Dynamically evaluates behavior against dynamic baselines |
| Pattern Detection | Relies on manual dashboard inspection | Uses automated mathematical clustering and pattern discovery |
| Incident Prioritization | Follows rigid, predefined severity tags | Dynamically scores severity based on business impact and blast radius |
| Anomaly Detection | Triggers only after hard limit breaches | Identifies subtle shifts and deviations before thresholds break |
| Root Cause Analysis | Requires manual cross-system log correlation | Correlates topology, telemetry, and change events automatically |
| Operational Posture | Primarily reactive to outages | Predictive and proactive based on trend indicators |
| Automation | Triggered via rigid, manual scripts | Guided by verified analytical insights with human guardrails |
| Decision Support | Relies heavily on individual engineer memory | Enriched by historical incident data and resolution patterns |
While ML significantly improves workflow efficiency, it does not imply that every operational task can or should be fully automated.
How Machine Learning Processes IT Data
To deliver meaningful insights without overwhelming the team, machine learning systems follow a structured data pipeline:
[Data Ingestion] ──> [Preparation] ──> [Feature Extraction] ──> [Model Scoring] ──> [Pattern Matching] ──> [Classification] ──> [Actionable Insight]
- Data Ingestion: Gathers continuous telemetry from monitoring agents, syslog aggregators, cloud provider APIs, and ITSM platforms.
- Data Preparation & Normalization: Cleans unstructured logs, aligns disparate timestamps across time zones, and removes redundant records.
- Feature Extraction: Identifies critical variables that represent system health, such as request rates, error ratios, latency percentiles, and resource consumption slopes.
- Model Analysis: Ingests the normalized feature sets into specialized statistical and machine learning models.
- Pattern Recognition: Evaluates the current state against learned behavioral baselines to separate expected variance (e.g., scheduled backups) from abnormal behavior.
- Classification & Prediction: Categorizes the event by potential impact type or estimates the probability of service degradation.
- IT Action Support: Surfaces enriched context directly within the engineer’s operational console or triggers an approved, pre-authorized remediation task.
Machine Learning for Anomaly Detection
Anomaly detection is the process of identifying data points, events, or observations that deviate significantly from an established norm or baseline.
In dynamic cloud architectures, static thresholds (e.g., alert if CPU exceeds 80%) frequently fail. A database running at 85% CPU during an expected Monday morning batch job is normal, whereas the same database running at 85% CPU at 3:00 AM on Sunday morning may indicate a severe performance stall or security event.
[Baseline Profiling] ──> [Ingest New Telemetry] ──> [Statistical Comparison] ──> [Anomaly Scored]
Common IT anomalies identified by machine learning include:
- Unusual Resource Spikes: Sudden, unexplained increases in memory consumption or disk queue depth.
- Latency Drift: Gradual, systemic increases in API response times across distributed microservices.
- Traffic Anomalies: Unexpected drops or surges in inbound network requests.
- Error Rate Deviations: Sudden spikes in HTTP 5xx server errors relative to total request volume.
By calculating dynamic baselines that adjust for seasonality, time of day, and business cycles, machine learning helps teams detect underlying degradations before end users experience an outage.
Machine Learning for Intelligent Alerting
Operational teams frequently suffer from alert fatigue—a condition where engineers are overwhelmed by hundreds or thousands of low-priority, non-actionable, or duplicate monitoring alerts every day. When critical outages occur, their signals often get lost in the noise.
Machine learning mitigates alert fatigue through intelligent signal processing:
- Deduplication: Aggregates repetitive alerts triggered by the same underlying component failure.
- Contextual Grouping: Clusters related alerts occurring across different tiers of the same application into a single manageable incident.
- Adaptive Thresholding: Dynamically suppresses noise from known, transient spikes that do not affect user experience.
- Severity Scoring: Re-orders the operations queue so engineers address critical service degradations first.
Machine learning does not promise zero false positives or zero false negatives. Algorithms can still misclassify an event, which is why alerting pipelines must allow engineers to provide feedback and tune sensitivity.
Machine Learning for Event Correlation
When an infrastructure component degrades, it often triggers a cascade of secondary alarms across interconnected services.
Consider this common cascading sequence:
$$\text{Database Storage Exhaustion} \longrightarrow \text{Query Latency Spike} \longrightarrow \text{API Gateway Timeouts} \longrightarrow \text{Frontend Application Errors}$$
A traditional monitoring system might treat this chain reaction as four separate, high-priority emergencies, routing tickets to the database administrator, backend team, network engineer, and frontend developer simultaneously.
Machine learning event correlation examines the temporal proximity, network topology, and historical dependency graphs of these events. Instead of creating four disjointed tickets, it groups them into a single consolidated incident, identifying that the API and frontend errors are downstream symptoms of the upstream database issue.
Machine Learning for Root Cause Analysis
Root Cause Analysis (RCA) involves identifying the fundamental breakdown that initiated an incident. Finding the root cause in microservices architectures with thousands of ephemeral containers is time-consuming.
Machine learning accelerates RCA by analyzing relationships across:
- Infrastructure metrics and service-level dependencies
- System log messages preceding the failure
- Code deployment and configuration change events
- Historical incident patterns and resolution notes
[Topology Mapping] + [Telemetry Cross-Correlation] + [Change Logs] ──> [Ranked Probable Causes]
Important Caveat: Machine learning does not magically solve root cause analysis with 100% certainty. It acts as an accelerator that ranks the most mathematically probable causes, allowing systems engineers to validate the findings and execute the proper fix.
Machine Learning for Predictive IT Operations
Predictive IT operations shifts the operations model from reactive troubleshooting to proactive maintenance by forecasting problems before they disrupt service delivery:
$$\text{Historical Data} + \text{Real-Time Telemetry} \longrightarrow \text{ML Forecasting Model} \longrightarrow \text{Probability Estimate} \longrightarrow \text{Preventive Action}$$
Key operational applications include:
- Storage and Capacity Planning: Predicting the exact timeframe when a storage volume or database cluster will run out of space based on non-linear consumption trends.
- Performance Degradation Warnings: Identifying memory leaks or resource exhaustion trajectories hours before an application crashes.
- Hardware Failure Risk: Analyzing disk drive I/O errors and SMART telemetry to forecast storage hardware failures.
- Workload Demand Forecasting: Predicting traffic surges to proactively scale compute resources ahead of demand.
Because predictions are statistical probabilities rather than certainties, operational teams should treat them as risk indicators that guide inspections and preventative maintenance.
Machine Learning for Incident Management
Machine learning provides specialized assistance across every major phase of the ITIL and SRE incident management lifecycles:
| Incident Stage | Role of Machine Learning | Operational Benefit |
| Detection | Monitors time-series telemetry against dynamic baselines | Discovers latent service degradations faster |
| Classification | Automatically categorizes incoming tickets using NLP | Routes incidents to the correct engineering team immediately |
| Prioritization | Evaluates blast radius, affected users, and service criticality | Ensures high-impact issues receive immediate focus |
| Investigation | Correlates topology, deployment changes, and metrics | Reduces manual log searching across different consoles |
| Diagnosis | Surfaces ranked probable causes based on historical data | Accelerates mean time to understand the issue |
| Resolution | Recommends proven remediation scripts or knowledge base articles | Helps on-call engineers apply vetted operational fixes |
| Post-Incident Review | Compiles incident timelines and event sequences automatically | Simplifies post-mortem documentation and knowledge capture |
Machine Learning and IT Automation
Machine learning provides the analytical intelligence needed to make IT automation safer and more effective. By validating whether an anomaly is genuine, ML helps ensure automated scripts run only when appropriate:
$$\text{ML Analytical Insight} \longrightarrow \text{Policy / Rule Evaluation} \longrightarrow \text{Automated Task Execution} \longrightarrow \text{Telemetry Verification}$$
Common low-risk automation use cases supported by ML include:
- Automatically creating and populating incident tickets with enriched diagnostic data
- Routing alerts to specific on-call engineers via integration with paging systems
- Gathering and attaching relevant application log snippets directly to an active incident
- Triggering routine diagnostic collections (such as thread dumps or network traces) when an anomaly is first detected
For high-impact operational changes—such as restarting production database clusters or rolling back critical application releases—automation should require explicit human confirmation and validation.
Machine Learning in Cloud and Multi-Cloud Operations
Modern multi-cloud environments combine virtual machines, ephemeral Kubernetes clusters, serverless functions, and managed database services. The sheer volume and velocity of telemetry produced across these distributed layers make human-only oversight impractical.
Machine learning helps teams manage multi-cloud operational complexity by:
- Normalizing Multi-Source Telemetry: Ingesting and standardizing metrics and logs across diverse cloud provider platforms.
- Tracking Dynamic Topologies: Adapting to microservices and containers that spin up and terminate in seconds.
- Optimizing Cloud Resource Allocation: Analyzing historical workload utilization to identify over-provisioned compute instances and reduce unnecessary cloud spend.
- Cross-Cloud Dependency Mapping: Surfacing latency bottlenecks across hybrid networks connecting on-premises data centers to public cloud environments.
Machine Learning for IT Service Management (ITSM)
IT Service Management workflows often suffer from manual processing delays. Service desks receive unstructured user tickets that must be read, classified, prioritized, and assigned manually.
Machine learning enhances ITSM operations using Natural Language Processing (NLP):
- Automatic Ticket Categorization: Reads the text description of an incoming ticket and applies the correct category, subcategory, and urgency tags.
- Intelligent Routing: Directs the ticket directly to the specialized team responsible for that service, bypassing tier-1 triage delays.
- Similar-Incident Suggestions: Surfaces previous incident tickets with similar symptoms and displays the historical resolutions that resolved them.
- Virtual Agent Assistance: Resolves standard employee requests (e.g., password resets or software access) through automated conversational interfaces.
Machine Learning and Observability
Observability is the degree to which you can infer the internal state of a complex system based on its external outputs: metrics, logs, traces, and events (the core telemetry types).
While observability platforms are responsible for collecting, storing, and visualizing this telemetry, machine learning acts as the analytical engine that processes the data at scale:
$$\text{Observability Telemetry (M.E.L.T.)} \longrightarrow \text{ML Pattern Analysis} \longrightarrow \text{Topology Correlation} \longrightarrow \text{Operational Action}$$
Observability provides the raw visibility; machine learning surfaces the meaningful signals hidden inside the massive volume of data.
Supervised vs. Unsupervised Learning in IT Operations
The two primary paradigms of machine learning applied within IT operations workflows are supervised and unsupervised learning:
| Dimension | Supervised Machine Learning | Unsupervised Machine Learning |
| Core Concept | Learns from labeled training datasets | Identifies hidden patterns in unlabeled telemetry |
| Training Requirement | Requires historical examples of inputs paired with correct outputs | Ingests raw telemetry and learns structure autonomously |
| Primary IT Use Cases | Ticket classification, incident severity tagging, failure prediction | Anomaly detection, alert clustering, behavioral baselining |
| Operational Strengths | Highly accurate for specific, well-defined operational tasks | Excellent for detecting novel, previously unseen failure modes |
| Primary Limitations | Requires consistent, accurately labeled historical incident records | Can produce false positives if baselines are poorly calibrated |
Machine Learning Models and Continuous Learning
IT environments are not static; they change constantly with every continuous integration and continuous deployment (CI/CD) cycle, infrastructure upgrade, and user traffic shift.
Because system behavior shifts over time, a machine learning model calibrated on last month’s telemetry can become inaccurate if not maintained. This phenomenon is known as model drift.
$$\text{System Changes} \longrightarrow \text{Telemetry Profile Shifts} \longrightarrow \text{Model Drift} \longrightarrow \text{Evaluation} \longrightarrow \text{Model Retraining}$$
To ensure long-term accuracy, operations teams must:
- Continuously monitor model performance against real-world incident outcomes.
- Periodically retrain models on updated telemetry that reflects current application baselines.
- Allow engineers to submit direct feedback (marking alerts as true or false positives) to tune model weights.
Benefits of Machine Learning for IT Workflows
Implementing machine learning across operational pipelines provides clear, measurable operational improvements:
- Accelerated Anomaly Detection: Surfaces subtle performance degradations before they cause user-facing outages.
- Substantial Alert Noise Reduction: Aggregates and deduplicates repetitive alerts into actionable notifications.
- Automated Cross-Tier Event Correlation: Connects isolated telemetry signals across infrastructure, application, and network tiers.
- Improved Incident Triage and Prioritization: Automatically routes and categorizes incidents based on estimated business impact.
- Shortened Investigation Timelines: Provides on-call engineers with relevant log snippets, topology maps, and diagnostic context.
- Proactive Capacity and Demand Planning: Forecasts resource exhaustion risks weeks in advance.
- Elimination of Repetitive Manual Tasks: Automates initial diagnostic collection, ticket enrichment, and notification routing.
- Holistic Infrastructure Visibility: Unifies telemetry across hybrid cloud, on-premises, and containerized environments.
- Preservation of Institutional Knowledge: Surfaces proven past resolutions when similar incident patterns recur.
- Shift to Proactive IT Posture: Enables teams to focus on system resilience and optimization rather than constant firefighting.
Challenges of Using Machine Learning in IT Workflows
Adopting machine learning in operational environments comes with distinct organizational and technical challenges:
- Telemetry Data Quality: Inconsistent logging formats, missing timestamps, and uncalibrated metrics directly impair model accuracy.
- Siloed Monitoring Systems: Fragmented monitoring tools prevent algorithms from accessing unified, cross-domain telemetry.
- Managing False Positives: Highly sensitive anomaly detection models can flood teams with false alarms, undermining trust.
- Risk of False Negatives: Overly aggressive noise-filtering rules might suppress critical warning signs of an outage.
- Model Drift Over Time: Frequent application releases and infrastructure updates can quickly invalidate established baselines.
- Complex Infrastructure Integrations: Ingesting high-cardinality telemetry across modern distributed stacks requires significant pipeline engineering.
- Lack of Model Explainability: “Black-box” algorithms that output alerts without explaining their reasoning are difficult for engineers to trust.
- Internal Skills Gaps: IT operations teams often lack foundational experience with data engineering and machine learning concepts.
- Risks of Over-Automation: Triggering automated remediation scripts without sufficient validation checks can worsen an active outage.
- Cultural Resistance to Adoption: Operations teams may hesitate to adopt ML recommendations if past tools produced noisy results.
High-performing machine learning outcomes depend fundamentally on high-quality operational data.
Human Oversight in ML-Driven IT Operations
Machine learning is an analytical engine designed to support human engineers, not replace them.
$$\text{ML Analytics: Signal Detection \& Recommendations} \Longleftrightarrow \text{Human Engineers: Context, Judgment \& Execution}$$
Human judgment remains essential across multiple operational areas:
- Contextual Evaluation: Evaluating whether an anomaly is a genuine incident or expected behavior from an unannounced deployment.
- High-Impact Remediation: Approving actions that carry operational risk, such as rolling back services or rebooting core databases.
- Complex Problem Solving: Formulating novel architectural fixes for edge cases that have never occurred in the historical training data.
- Governance and Accountability: Setting operational boundaries, compliance guardrails, and validation criteria for automated systems.
Practical Example: ML-Assisted Incident Workflow
To see these concepts in action, consider the following hypothetical operational scenario:
[Latency Anomaly Detected] ──> [Events Correlated] ──> [Incident Scored P1] ──> [Diagnostics Attached] ──> [Engineer Approves Fix] ──> [System Recovers]
- Telemetry Anomaly Detection: An e-commerce application’s checkout service experiences an unusual, gradual 250ms increase in p99 API latency. While the latency is still below the static alert threshold of 500ms, the ML engine identifies this as a deviation from standard Friday afternoon baselines.
- Cross-Tier Event Correlation: The ML platform correlates this latency drift with a simultaneous increase in database connection pool waits and a container deployment that occurred 10 minutes prior.
- Prioritized Incident Creation: Rather than firing 15 isolated alerts, the system creates a single P1 incident ticket, categorizes it as “Database Contention Post-Deployment,” and assigns it to the on-call SRE.
- Diagnostic Enrichment: The platform automatically queries the database cluster, identifies three unindexed queries introduced in the recent release, and attaches these findings directly to the incident summary.
- Validated Human Remediation: The on-call SRE reviews the telemetry summary, confirms that the new release caused the database bottleneck, and approves an automated rollback script.
- Automated Verification: The system monitors real-time telemetry following the rollback, confirming that API latency and connection pool metrics have returned to their normal baseline.
Traditional IT Workflow vs. ML-Enabled Workflow
| Operational Activity | Traditional IT Approach | ML-Enabled Approach |
| System Monitoring | Static, hardcoded thresholds checked at fixed intervals | Dynamic baselining that continuously adapts to seasonal patterns |
| Alert Handling | Manual triage of individual, siloed notifications | Automatic deduplication and cross-system event correlation |
| Issue Investigation | Manual log searching across multiple monitoring tools | Automated timeline construction and diagnostic data enrichment |
| Capacity Management | Reactive expansions triggered after disk/memory fills | Predictive forecasts that project capacity exhaustion dates |
| Incident Escalation | Manual routing through tier-1 and tier-2 support queues | Automated NLP-based ticket categorization and direct team assignment |
| Task Automation | Manually executed scripts triggered by human operators | Context-aware automation executing under policy-based guardrails |
| Continuous Learning | Post-mortems documented in static wiki pages | Historical resolution data ingested to improve future recommendations |
How Organizations Can Introduce ML Into IT Workflows
Adopting machine learning in operational workflows works best as an iterative, step-by-step rollout:
[Pick Use Case] ──> [Audit Data] ──> [Clean Telemetry] ──> [Run Pilot] ──> [Measure Impact] ──> [Add Guardrails] ──> [Scale]
- Step 1: Identify a Specific Problem: Select a well-defined operational pain point, such as alert fatigue from a noisy application tier or slow ticket routing.
- Step 2: Review Available Data: Audit the quality, completeness, and retention periods of your logs, metrics, events, and historical ITSM tickets.
- Step 3: Improve Data Quality: Standardize log formats, align timestamp configurations, and clean up duplicate monitoring streams.
- Step 4: Select an Initial ML Use Case: Begin with a low-risk, high-value problem such as unsupervised anomaly detection on core metrics or automated ticket categorization.
- Step 5: Run a Pilot Project: Deploy the model in a non-production or shadow environment alongside existing monitoring workflows to evaluate performance without operational risk.
- Step 6: Measure Baseline Results: Quantify improvements in alert volume reduction, false positive rates, and engineer triage time.
- Step 7: Introduce Guardrailed Automation: Connect ML outputs to low-risk automations first (e.g., ticket enrichment and notification routing) before considering remediation tasks.
- Step 8: Monitor Model Health: Track model drift and recalibrate baselines regularly as infrastructure configurations change.
- Step 9: Establish Engineer Feedback Loops: Provide simple mechanisms for on-call engineers to validate or reject model insights.
- Step 10: Scale Systematically: Expand machine learning capabilities to adjacent operational workflows only after the initial use case demonstrates stable value.
Metrics for Measuring ML in IT Workflows
Evaluating the success of machine learning in IT operations requires tracking both operational performance and model health:
| Metric Name | What It Measures | Target Direction |
| Mean Time to Detect (MTTD) | The average time required to identify an active system degradation | Decrease |
| Mean Time to Resolve (MTTR) | The average time taken to restore full service functionality | Decrease |
| Alert Volume | The total quantity of raw notifications sent to operations teams | Decrease (via deduplication) |
| False Positive Rate | The percentage of generated alerts that represent non-issues | Decrease |
| Ticket Categorization Accuracy | The proportion of support tickets routed to the correct team on first pass | Increase |
| Prediction Accuracy | The percentage of capacity or failure forecasts that prove correct | Increase |
| Automation Success Rate | The proportion of automated tasks executed without errors or rollbacks | Increase |
| Model Drift Index | The statistical divergence between training baselines and real-time data | Stabilize / Minimize |
| Service Availability | The overall uptime and reliability percentage of business services | Increase |
| Engineer Toil Hours | The total time engineers spend on repetitive, manual operational tasks | Decrease |
The Future of Machine Learning in IT Workflows
The intersection of machine learning, artificial intelligence, and IT operations is evolving across several distinct horizons:
[Current: Dynamic Baselining & Alert Grouping]
       │
       ▼
[Emerging: GenAI Incident Summaries & Topology Assistants]
       │
       ▼
[Future Horizon: Policy-Governed Autonomous Remediation Agents]
- Generative AI for Incident Summarization: Natural language models that analyze complex log traces, alert threads, and chat logs to draft real-time executive summaries and post-mortem reports.
- Autonomous AI Operations Agents: Specialized, policy-constrained software agents capable of executing multi-step diagnostic workflows and proposing remediation plans for engineer approval.
- Advanced Predictive Infrastructure: Deep learning models trained on large-scale telemetry that forecast complex multi-service performance bottlenecks days before they manifest.
- Automated Dependency Mapping: Real-time, continuous discovery of microservice relationships using distributed tracing and ML-driven graph analytics.
- Intelligent Observability Pipelines: Edge-deployed machine learning filters that analyze and summarize high-cardinality telemetry directly at the source, dramatically reducing storage costs.
- Controlled Self-Healing Architectures: Highly validated, closed-loop automation frameworks capable of autonomously mitigating known, transient failure modes within strict safety boundaries.
Skills Needed to Work With ML in IT Operations
Professionals looking to understand and implement machine learning in operational environments can build their skills across three progressive stages:
[1. Systems Core] ──> [2. Data & Scripting] ──> [3. AIOps & ML Integration]
Stage 1: Core Operations Fundamentals
Beginners should first master foundational infrastructure, networking, and operations principles:
- Linux Systems Administration: Core operating system concepts, process management, log parsing, and performance tuning.
- Networking Fundamentals: TCP/IP models, DNS routing, load balancing, and network troubleshooting.
- Cloud Architecture: Core concepts across AWS, Azure, or Google Cloud Platform.
- Observability Foundations: Practical experience working with time-series metrics, structured logging, and distributed tracing.
Stage 2: Data & Scripting Foundations
Next, build competence in managing operational data and building automations:
- Python Scripting: Writing scripts for API integration, data manipulation, and task automation.
- Data Analysis Tools: Working with data libraries such as Pandas and NumPy to clean and analyze operational datasets.
- Structured Querying: Using SQL and specialized time-series query languages (e.g., PromQL, LogQL).
Stage 3: Applied Machine Learning & AIOps
Finally, apply machine learning techniques to operational workflows:
- Machine Learning Fundamentals: Understanding regression, classification, clustering, and anomaly detection algorithms.
- AIOps Architectures: Learning how modern enterprise platforms ingest telemetry, correlate events, and interface with ITSM systems.
- Site Reliability Engineering (SRE) Principles: Applying Service Level Objectives (SLOs), error budgets, and blameless post-mortem frameworks to AI-assisted workflows.
The Role of TheAIOps.com
As enterprise IT architectures become more distributed and complex, understanding how machine learning intersects with IT operations is an essential skill for modern engineers and technology leaders.
TheAIOps.com provides structured educational resources, architectural breakdowns, and practical guides designed to help systems administrators, DevOps engineers, SREs, and IT managers build foundational knowledge in:
- Core AIOps concepts and operational architectures
- Applied machine learning for time-series anomaly detection
- Event correlation and intelligent noise reduction strategies
- Modern observability frameworks (Metrics, Events, Logs, and Traces)
- Safe IT automation practices and human-in-the-loop workflows
- Incident management modernizations and ITSM integrations
Whether you are designing an initial pilot to reduce alert fatigue or evaluating enterprise observability platforms, TheAIOps.com helps clarify the practical realities of modern AI-driven IT operations.
Common Misconceptions About ML in IT Operations
- Misconception 1: Machine learning will completely replace IT engineers.Reality: ML serves as an analytical co-pilot that surfaces insights and automates repetitive tasks. Human judgment, context, and problem-solving remain essential for complex operational decisions.
- Misconception 2: Ingesting more data automatically guarantees better ML results.Reality: Feeding unstructured, noisy, or duplicate telemetry into machine learning algorithms leads to inaccurate baselines and unreliable predictions. Data quality matters more than data volume.
- Misconception 3: Every operational workflow should be automated end-to-end.Reality: Automation should be applied selectively. High-risk, stateful operational actions require human verification and guardrails.
- Misconception 4: Machine learning predictions are always accurate.Reality: ML models produce probabilistic estimates, not guarantees. Forecasts must be evaluated as risk indicators rather than absolute facts.
- Misconception 5: AIOps is just a rebranding of traditional monitoring.Reality: Traditional monitoring tracks static threshold breaches on isolated systems. AIOps applies machine learning across multiple telemetry sources to correlate events, detect anomalies, and assist workflows.
- Misconception 6: Anomaly detection automatically identifies the root cause of an outage.Reality: Anomaly detection identifies that a metric is behaving unusually. Finding the root cause requires topology mapping, event correlation, and human engineering validation.
- Misconception 7: Machine learning works out-of-the-box without continuous tuning.Reality: Production systems constantly change. Models must be monitored for drift, validated against operational outcomes, and retrained regularly.
- Misconception 8: Machine learning can compensate for missing observability data.Reality: ML algorithms can only analyze the telemetry they receive. If critical systems lack proper instrumentation, logging, or metric collection, machine learning cannot fill the visibility gap.
Frequently Asked Questions
What is machine learning in IT operations?
Machine learning in IT operations refers to using algorithms to analyze system telemetry—including metrics, logs, traces, and events—to identify operational patterns, detect abnormal system behavior, and support troubleshooting workflows.
How does machine learning improve IT workflows?
Machine learning improves IT workflows by automatically filtering out alert noise, correlating related events across distributed systems, accelerating root cause investigations, and enriching incident tickets with relevant diagnostic data.
How is ML used in AIOps?
In AIOps platforms, machine learning serves as the analytical core that processes high-volume telemetry streams in real time. It establishes dynamic behavioral baselines, groups related alerts, and provides predictive insights to streamline operations.
How does ML detect IT anomalies?
ML detects anomalies by analyzing historical performance data to build dynamic baselines that account for time-of-day and seasonal patterns. When incoming telemetry deviates significantly from these baselines, the system flags it as a potential issue.
Can machine learning predict IT incidents?
Machine learning can identify early warning signs—such as memory leak trajectories, gradual latency increases, or disk capacity consumption trends—enabling teams to address risks before they result in complete system outages.
How does ML reduce alert fatigue?
Machine learning reduces alert fatigue by deduplicating repetitive alerts, suppressing transient non-critical spikes, and clustering related notifications from multiple infrastructure layers into a single consolidated incident.
What is machine learning event correlation?
Event correlation is an analytical technique where ML algorithms evaluate timestamps, network topologies, and dependency maps to recognize that multiple distinct alerts are symptoms of the same underlying root cause.
What are the challenges of using ML in IT operations?
Key challenges include poor telemetry data quality, fragmented tool silos, managing false positives and false negatives, model drift caused by frequent software deployments, and a shortage of internal ML engineering expertise.
Does machine learning replace IT operations engineers?
No. Machine learning automates analytical data processing and routine diagnostic tasks, freeing human engineers to focus on architectural reliability, complex troubleshooting, strategic improvements, and critical incident response.
How can beginners learn machine learning for AIOps?
Beginners should start by building a strong foundation in Linux, networking, cloud platforms, and observability tools. From there, learn Python and basic statistical concepts before exploring specialized AIOps platforms and anomaly detection techniques on educational resources like TheAIOps.com.
Conclusion
Modern IT environments are too dynamic and data-intensive to be managed purely through manual dashboard reviews and static alert thresholds. Machine learning provides the analytical foundation needed to transform noisy, reactive operations into proactive, data-driven workflows. By continuously analyzing telemetry, detecting subtle anomalies, correlating complex event cascades, and streamlining routine diagnostic tasks, ML allows engineering teams to focus on system resilience and high-value initiatives. Successful adoption requires starting with clean operational data, maintaining human judgment for critical decisions, applying automation safely, and actively managing model performance over time.
