Upgrade & Secure Your Future with DevOps, SRE, DevSecOps, MLOps!
We spend hours scrolling social media and waste money on things we forget, but won’t spend 30 minutes a day earning certifications that can change our lives.
Master in DevOps, SRE, DevSecOps & MLOps by DevOps School!
Learn from Guru Rajesh Kumar and double your salary in just one year.
Introduction
Network Monitoring Tools are essential platforms for IT teams to monitor, analyze, and manage network performance, availability, and security. These tools provide real-time insights into network traffic, device health, and connectivity, enabling organizations to quickly detect issues, prevent downtime, and optimize network resources.
In modern IT environments, networks are increasingly complex due to hybrid infrastructure, cloud deployments, and distributed systems. Network monitoring tools help organizations maintain uptime, troubleshoot performance issues, enforce compliance, and ensure seamless connectivity for business operations.
Real-world use cases include monitoring bandwidth utilization, detecting and resolving network outages, analyzing traffic patterns for optimization, ensuring compliance with security policies, and integrating with ITSM or incident management workflows. Buyers should evaluate scalability, real-time alerting, customizable dashboards, multi-vendor device support, integration with monitoring and security tools, analytics and reporting, automated remediation, ease of use, and cost-effectiveness.
Best for: IT operations teams, network engineers, SMBs, enterprises, cloud-based service providers, and organizations with large-scale or hybrid networks.
Not ideal for: very small networks, environments with minimal IT infrastructure, or teams with limited monitoring needs.
Key Trends in Network Monitoring Tools
- AI-driven anomaly detection for proactive issue identification.
- Integration with cloud and hybrid network infrastructures.
- Automated remediation workflows to reduce mean time to resolution (MTTR).
- Predictive analytics for bandwidth and performance trends.
- Unified dashboards consolidating multiple network devices and vendors.
- Multi-channel alerting via email, SMS, and messaging platforms.
- Enhanced security monitoring with compliance tracking.
- API access for automation and integration with ITSM and DevOps tools.
- Mobile applications for real-time monitoring and alerts.
- Flexible deployment models including cloud, on-premise, and hybrid.
How We Selected These Tools
- Evaluated market adoption and reputation among IT and enterprise organizations.
- Reviewed feature completeness for real-time monitoring, alerting, and reporting.
- Assessed reliability, scalability, and performance under high traffic conditions.
- Checked security posture including encryption, RBAC, and compliance certifications.
- Examined integration capabilities with ITSM, DevOps, and monitoring platforms.
- Evaluated dashboards, analytics, and reporting for actionable insights.
- Considered automation features including alert deduplication and remediation.
- Reviewed multi-cloud, hybrid, and multi-vendor support.
- Assessed vendor support, documentation, and community adoption.
- Focused on practical operational value for SMBs and enterprises.
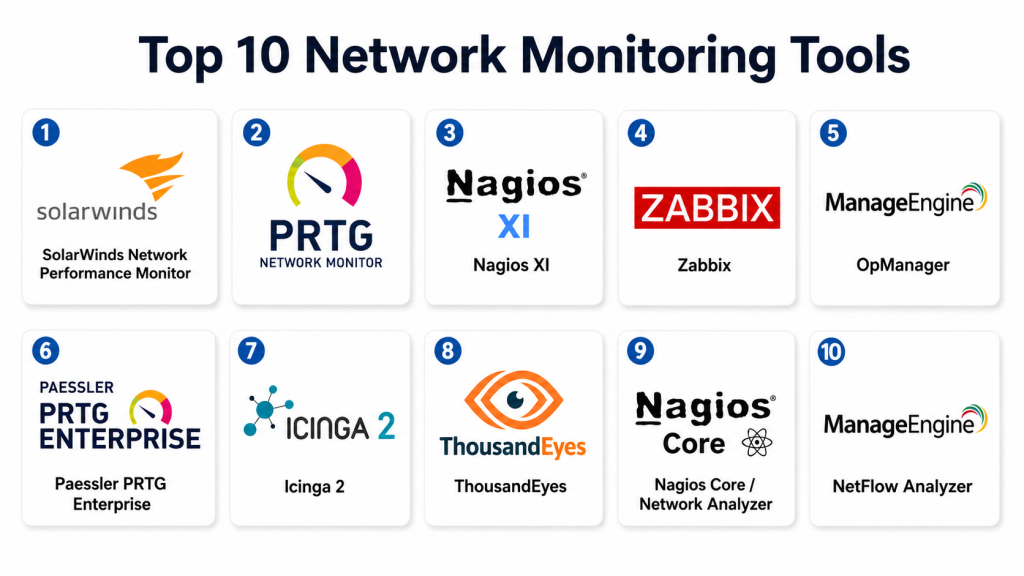
Top 10 Network Monitoring Tools
#1 — SolarWinds Network Performance Monitor
Short description: SolarWinds NPM provides comprehensive network performance monitoring, alerting, and visualization for enterprise and mid-market networks.
Key Features
- Real-time network performance monitoring.
- Intelligent alerts and thresholds.
- Topology mapping and visualization.
- Multi-vendor device support.
- Automated network discovery.
- Historical reporting and analytics.
- Customizable dashboards.
Pros
- Enterprise-grade scalability.
- Strong alerting and reporting features.
- Broad device compatibility.
Cons
- Can be complex for small teams.
- Premium pricing for full features.
- Setup requires configuration.
Platforms / Deployment
Web / Windows
On-premise / Hybrid
Security & Compliance
Supports RBAC, encryption, and audit logging; SOC 2 and ISO certifications vary.
Integrations & Ecosystem
- ITSM tools like ServiceNow
- Slack, Teams notifications
- SNMP and Syslog-based devices
- Cloud monitoring integrations
Support & Community
Vendor support, documentation, and active online community.
#2 — PRTG Network Monitor
Short description: PRTG provides network and system monitoring for SMBs and enterprises with customizable alerts and dashboards.
Key Features
- Real-time monitoring for devices and traffic.
- Auto-discovery of network devices.
- Multi-sensor monitoring for bandwidth, latency, and uptime.
- Customizable alerts and notifications.
- Historical data collection.
- Reporting and dashboards.
- API for automation.
Pros
- Flexible and scalable for SMBs and mid-size enterprises.
- Easy to deploy with auto-discovery.
- Cost-effective licensing.
Cons
- Interface can be complex for new users.
- Advanced features require premium licensing.
- Reporting options are limited without add-ons.
Platforms / Deployment
Web / Windows
On-premise / Hybrid
Security & Compliance
Supports encrypted communication and RBAC; certifications vary.
Integrations & Ecosystem
- Slack, Teams, email notifications
- ITSM tools
- SNMP-enabled devices
- API-based custom integrations
Support & Community
Vendor documentation, tutorials, and active user forums.
#3 — Nagios XI
Short description: Nagios XI offers enterprise-grade network, server, and application monitoring with alerting and visualization capabilities.
Key Features
- Comprehensive network and server monitoring.
- Customizable dashboards and views.
- Alerting and escalation policies.
- Multi-vendor support.
- Reporting and SLA tracking.
- API access for integrations.
- Plugin architecture for extended monitoring.
Pros
- Highly customizable and extensible.
- Strong monitoring capabilities across devices.
- Active open-source community.
Cons
- Steep learning curve.
- Configuration can be time-consuming.
- Premium version required for advanced features.
Platforms / Deployment
Web / Linux / Windows
On-premise / Hybrid
Security & Compliance
Supports RBAC, encrypted connections, and audit logging.
Integrations & Ecosystem
- ITSM platforms
- Slack, Teams
- Custom plugins and scripts
- SNMP, WMI, and cloud APIs
Support & Community
Vendor support available; strong community contributions and plugin ecosystem.
#4 — Zabbix
Short description: Zabbix is an open-source network monitoring tool that provides performance, availability, and alerting for IT infrastructure.
Key Features
- Real-time network monitoring and alerting.
- Flexible notification system.
- Multi-platform support.
- Custom dashboards and reports.
- Historical data analysis.
- API for automation.
- Template-based configuration.
Pros
- Free and open-source.
- Highly customizable.
- Scales from SMB to enterprise.
Cons
- Self-hosting required.
- Setup and configuration can be complex.
- Limited professional support unless using enterprise plan.
Platforms / Deployment
Web / Linux / Windows
Self-hosted / Hybrid
Security & Compliance
Supports encryption, authentication, and RBAC; depends on deployment configuration.
Integrations & Ecosystem
- Slack, email notifications
- Monitoring scripts and SNMP
- Cloud integrations
- API for CI/CD and automation
Support & Community
Community support; optional enterprise support available.
#5 — ManageEngine OpManager
Short description: OpManager offers network monitoring, traffic analysis, and alerting for SMB and enterprise IT teams.
Key Features
- Real-time network monitoring.
- Bandwidth and traffic analysis.
- Alerting and notifications.
- Multi-vendor device support.
- Customizable dashboards.
- Historical reports and analytics.
- Automated network discovery.
Pros
- User-friendly interface.
- Affordable for SMBs.
- Comprehensive monitoring features.
Cons
- Advanced analytics require higher tiers.
- Scaling for very large environments can be complex.
- Some integrations are limited.
Platforms / Deployment
Web / Windows
On-premise / Hybrid
Security & Compliance
Supports RBAC and encrypted communication; certifications vary.
Integrations & Ecosystem
- ITSM tools
- Slack, Teams
- SNMP and Syslog devices
- API for automation
Support & Community
Vendor support with tutorials and documentation.
#6 — Paessler PRTG Enterprise
Short description: Enterprise-focused version of PRTG providing high scalability, alerting, and network insights.
Key Features
- High-scale network monitoring.
- Multi-sensor support.
- Centralized dashboards.
- Alerts, notifications, and SLA tracking.
- API for automation.
- Historical analysis and reporting.
- Multi-cloud support.
Pros
- Scalable for large IT infrastructures.
- Reliable monitoring and alerting.
- Flexible dashboards and analytics.
Cons
- Higher cost for enterprise edition.
- Complexity increases with large deployments.
- Learning curve for configuration.
Platforms / Deployment
Web / Windows
Cloud / On-premise
Security & Compliance
Supports RBAC, encryption, and audit logs; certifications vary.
Integrations & Ecosystem
- ITSM and DevOps tools
- Slack, Teams
- SNMP, WMI, cloud APIs
- CI/CD integration
Support & Community
Vendor support and documentation; enterprise user community.
#7 — Icinga 2
Short description: Icinga 2 is an open-source monitoring platform that tracks network and system performance with alerts and reporting.
Key Features
- Real-time network monitoring.
- Multi-vendor device support.
- Alerting and escalation.
- Dashboard and reporting capabilities.
- API access for integration.
- Historical data and SLA tracking.
- Customizable monitoring templates.
Pros
- Free and open-source.
- Flexible and extensible.
- Strong community support.
Cons
- Requires self-hosting.
- Setup can be complex.
- Limited enterprise-level support unless purchased.
Platforms / Deployment
Web / Linux / Windows
Self-hosted / Hybrid
Security & Compliance
Encryption and RBAC; compliance depends on deployment.
Integrations & Ecosystem
- Slack, Teams
- SNMP, WMI
- ITSM tools
- API for automation
Support & Community
Community-driven support; optional enterprise support.
#8 — ThousandEyes
Short description: ThousandEyes monitors end-to-end network performance, internet, and cloud connectivity for enterprises.
Key Features
- Network, internet, and cloud monitoring.
- End-to-end visibility across networks.
- Real-time alerts and notifications.
- Performance dashboards and reporting.
- API for integration.
- Multi-cloud support.
- SLA and uptime tracking.
Pros
- Detailed end-to-end visibility.
- Strong analytics and reporting.
- Ideal for cloud and hybrid environments.
Cons
- Premium pricing.
- Complexity for smaller teams.
- Requires training to leverage full features.
Platforms / Deployment
Web / Linux / Windows
Cloud
Security & Compliance
Supports RBAC, encryption, and audit logging; enterprise certifications vary.
Integrations & Ecosystem
- Slack, Teams
- ITSM tools
- Cloud monitoring platforms
- CI/CD pipelines
- APIs for automation
Support & Community
Vendor support and documentation; enterprise community.
#9 — Nagios Core / Network Analyzer
Short description: Nagios Core with Network Analyzer plugin monitors network traffic, availability, and performance for open-source deployments.
Key Features
- Network and traffic monitoring.
- Alerting and notification.
- SNMP monitoring for devices.
- Historical reporting.
- Dashboards and visualization.
- Plugin-based extensibility.
- API for automation.
Pros
- Free and open-source.
- Flexible and extensible.
- Large community support.
Cons
- Requires self-hosting and configuration.
- Interface less user-friendly.
- Enterprise features require paid Nagios XI.
Platforms / Deployment
Web / Linux / Windows
Self-hosted
Security & Compliance
Supports encryption, RBAC; compliance depends on hosting.
Integrations & Ecosystem
- SNMP devices
- Slack, Teams
- ITSM and DevOps integrations
- API for automation
Support & Community
Community-driven support; optional enterprise support available.
#10 — ManageEngine NetFlow Analyzer
Short description: NetFlow Analyzer monitors bandwidth, traffic patterns, and network performance for SMB and enterprise networks.
Key Features
- Real-time bandwidth monitoring.
- Traffic analysis and reporting.
- Alerting for thresholds and outages.
- Multi-vendor device support.
- Customizable dashboards.
- SLA tracking and historical analytics.
- Integration with monitoring tools.
Pros
- Effective for bandwidth and traffic analysis.
- Easy to use for SMBs.
- Affordable licensing options.
Cons
- Limited AI-driven insights.
- Scaling requires enterprise edition.
- Advanced analytics require configuration.
Platforms / Deployment
Web / Windows / Linux
Cloud / On-premise
Security & Compliance
Supports RBAC, encryption, and audit logging; certifications vary.
Integrations & Ecosystem
- ITSM tools
- Slack, Teams
- SNMP devices
- API integrations
Support & Community
Vendor support and documentation available; active ManageEngine community.
Comparison Table
| Tool Name | Best For | Platform(s) Supported | Deployment | Standout Feature | Public Rating |
|---|---|---|---|---|---|
| SolarWinds NPM | Enterprise / Mid-market | Web / Windows | On-premise / Hybrid | Topology mapping & alerting | N/A |
| PRTG Network Monitor | SMB / Enterprise | Web / Windows | On-premise / Hybrid | Multi-sensor monitoring | N/A |
| Nagios XI | Enterprise | Web / Linux / Windows | On-premise / Hybrid | Customizable monitoring & plugins | N/A |
| Zabbix | SMB / Enterprise | Web / Linux / Windows | Self-hosted / Hybrid | Open-source flexibility | N/A |
| ManageEngine OpManager | SMB / Mid-market | Web / Windows | On-premise / Hybrid | Bandwidth & traffic analysis | N/A |
| PRTG Enterprise | Large-scale IT | Web / Windows | Cloud / On-premise | High-scale monitoring | N/A |
| Icinga 2 | SMB / Enterprise | Web / Linux / Windows | Self-hosted / Hybrid | Plugin-based monitoring | N/A |
| ThousandEyes | Enterprise / Cloud | Web / Linux / Windows | Cloud | End-to-end network visibility | N/A |
| Nagios Core + Analyzer | Open-source SMB | Web / Linux / Windows | Self-hosted | Traffic and network analysis | N/A |
| ManageEngine NetFlow Analyzer | SMB / Enterprise | Web / Windows / Linux | Cloud / On-premise | Bandwidth and traffic monitoring | N/A |
Evaluation & Scoring of Network Monitoring Tools
| Tool Name | Core (25%) | Ease (15%) | Integrations (15%) | Security (10%) | Performance (10%) | Support (10%) | Value (15%) | Weighted Total |
|---|---|---|---|---|---|---|---|---|
| SolarWinds NPM | 10 | 8 | 9 | 9 | 9 | 8 | 8 | 8.80 |
| PRTG Network Monitor | 9 | 8 | 8 | 8 | 8 | 8 | 8 | 8.10 |
| Nagios XI | 9 | 7 | 9 | 8 | 8 | 7 | 7 | 7.95 |
| Zabbix | 8 | 7 | 7 | 8 | 8 | 7 | 9 | 7.85 |
| ManageEngine OpManager | 8 | 8 | 7 | 8 | 8 | 7 | 8 | 7.95 |
| PRTG Enterprise | 9 | 7 | 8 | 8 | 8 | 8 | 7 | 7.95 |
| Icinga 2 | 8 | 7 | 7 | 8 | 8 | 7 | 8 | 7.75 |
| ThousandEyes | 10 | 7 | 9 | 9 | 9 | 8 | 7 | 8.40 |
| Nagios Core + Analyzer | 7 | 7 | 6 | 7 | 7 | 6 | 9 | 7.15 |
| NetFlow Analyzer | 8 | 8 | 7 | 8 | 8 | 7 | 8 | 7.85 |
Which Network Monitoring Tool Is Right for You?
Solo / Freelancer
PRTG Network Monitor, Zabbix, or Icinga 2 provide affordable, flexible monitoring for small networks.
SMB
ManageEngine OpManager, PRTG Enterprise, and NetFlow Analyzer offer scalable monitoring with alerting and dashboards.
Mid-Market
SolarWinds NPM, Nagios XI, and ThousandEyes provide advanced analytics, multi-vendor monitoring, and enterprise-grade dashboards.
Enterprise
ThousandEyes, SolarWinds NPM, Nagios XI, and PRTG Enterprise deliver full-scale monitoring, end-to-end visibility, and predictive analytics for large networks.
Budget vs Premium
Open-source or SMB-focused tools reduce costs. Enterprise platforms provide automation, AI-assisted insights, and multi-cloud capabilities at a premium.
Feature Depth vs Ease of Use
Enterprise tools offer deeper monitoring and analytics but require configuration. SMB tools focus on usability and fast deployment.
Integrations & Scalability
Ensure the platform integrates with ITSM, CI/CD, cloud services, and supports network expansion.
Security & Compliance Needs
Verify RBAC, encryption, audit logs, and compliance with relevant industry standards.
Frequently Asked Questions
What is network monitoring?
Network monitoring tracks device health, traffic, and performance to prevent outages and optimize IT operations.
Why do organizations need network monitoring tools?
They enable proactive detection of issues, reduce downtime, optimize performance, and ensure reliability.
Do these tools support multi-vendor devices?
Yes, most enterprise tools support SNMP, WMI, and multi-vendor network hardware.
Can they monitor cloud and hybrid environments?
Yes, many tools provide cloud-native and hybrid monitoring capabilities.
Are alerts and notifications available?
Yes, tools provide email, SMS, push, and messaging platform notifications.
Can SMBs benefit from network monitoring?
Yes. Tools like PRTG, Zabbix, and OpManager provide cost-effective monitoring for small networks.
Do these tools provide analytics and reporting?
Yes, they offer dashboards, historical reports, and performance metrics.
Can they integrate with ITSM and DevOps tools?
Yes. Most enterprise-grade platforms provide API and native integrations.
Are mobile monitoring apps available?
Yes, several tools provide mobile access for on-the-go monitoring and alerting.
How to choose the right network monitoring tool?
Consider network size, infrastructure complexity, integration needs, budget, and scalability.
Conclusion
Network Monitoring Tools are essential for maintaining reliable, high-performance IT environments. SMBs may benefit from PRTG Network Monitor, Zabbix, or Icinga 2 for cost-effective deployment. Mid-market teams can leverage SolarWinds NPM, ManageEngine OpManager, and Nagios XI for advanced monitoring and multi-vendor support. Enterprises require ThousandEyes, SolarWinds NPM, and PRTG Enterprise for end-to-end visibility, predictive analytics, and multi-cloud monitoring. Teams should shortlist two to three tools, validate integrations, and ensure security and compliance before deployment to optimize network reliability