Upgrade & Secure Your Future with DevOps, SRE, DevSecOps, MLOps!
We spend hours scrolling social media and waste money on things we forget, but won’t spend 30 minutes a day earning certifications that can change our lives.
Master in DevOps, SRE, DevSecOps & MLOps by DevOps School!
Learn from Guru Rajesh Kumar and double your salary in just one year.
Introduction
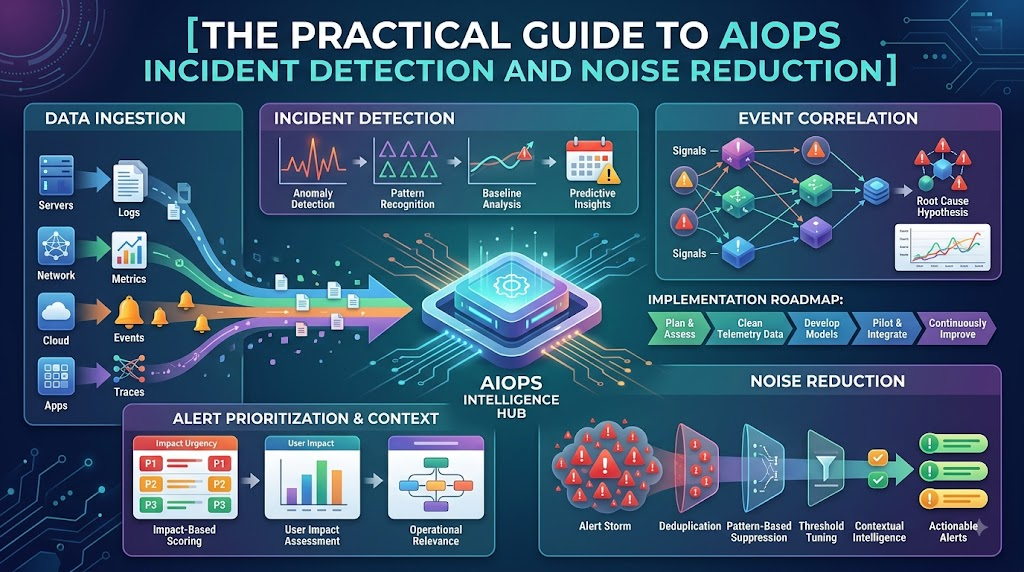
This is where Artificial Intelligence for IT Operations (AIOps) enters the picture. By continuously ingesting high-volume operational telemetry—including metrics, logs, traces, and events—AI models analyze complex patterns across your entire stack. Rather than forcing engineers to sift through disconnected warnings, AI helps correlate related signals, isolate baseline deviations, and highlight the core issue behind an outage. Faster incident detection is not about generating a higher volume of alarms. The true goal of AI-powered monitoring on platforms like TheAIOps.com is to cut through operational noise, surface meaningful anomalies early, and deliver actionable contextual insights to the engineers responsible for keeping systems online.
What Is an IT Incident?
An IT incident is an unplanned disruption, degradation, or complete failure of an IT service that negatively affects system performance, operational workflows, or end-user experience.
Common real-world examples include:
- Application Outages: An API gateway becomes unresponsive, preventing customers from logging in.
- Service Degradation: Search queries take 8 seconds instead of the normal 200 milliseconds.
- Database Bottlenecks: Connection pool exhaustion halts transactional write operations.
- Network Disruptions: Packet loss between distributed cloud regions causes microservice call timeouts.
- Infrastructure Failures: Hypervisors crash or container pods enter a continuous crash-loop state.
- Authentication Issues: An expired security certificate blocks single sign-on (SSO) workflows.
- Resource Leaks: A gradual memory leak slowly degrades server stability over multiple days.
Understanding the Progression: Event → Alert → Incident
To understand modern incident detection, beginners must master the distinction between these three terms:
[ Telemetry Event ] ───(Threshold/Model)───> [ System Alert ] ───(Service Impact)───> [ IT Incident ]
  "State Change"                               "Notification"                             "Real Problem"
- Event: Any observable occurrence or state change within an IT system (e.g., a user logs in, a server CPU reaches 75%, or a cron job completes). Most events are completely normal.
- Alert: A notification generated when a specific event or metric meets defined criteria or deviates from an expected state (e.g., “CPU utilization exceeded 90% for 5 minutes”).
- Incident: An active operational issue that impairs service quality or breaches service level agreements (SLAs), requiring human intervention or automated remediation.
An event is just data, an alert is a notification, and an incident is a problem that requires resolution.
Why Traditional Incident Detection Can Be Slow
Before exploring AI solutions, we must examine why legacy monitoring frameworks struggle with modern cloud architectures.
Traditional Monitoring Bottlenecks
 ├── Static Thresholds      ──> Trigger alerts on harmless temporary spikes
 ├── Siloed Tooling         ──> Fragmented visibility across teams
 ├── Alert Fatigue          ──> Engineers ignore warnings due to high volume
 ├── High Telemetry Volume  ──> Humans cannot process gigabytes of raw logs
 └── Distributed Topology   ──> Inter-service dependencies obscure root causes
- Static Alert Thresholds: Legacy tools rely heavily on rigid numerical rules (e.g., “Alert if disk usage is greater than 80%”). These rules cannot differentiate between a scheduled, harmless backup job and an unexpected runaway log file consuming storage.
- Fragmented Tooling Silos: Network, application, database, and cloud teams often work in separate monitoring platforms. During an incident, no single team has a unified view of dependencies across the complete stack.
- Alert Fatigue: When monitoring tools send thousands of low-priority, non-actionable notifications each week, on-call engineers become desensitized. Critical alerts get buried under heaps of noise.
- Manual Correlation and Triage: When an outage begins, responders must manually query log aggregators, cross-reference APM metrics, and inspect host resources to piece together what happened.
- Scale and Ephemeral Infrastructure: Microservices, serverless functions, and Kubernetes containers spin up and shut down dynamically across hybrid and multi-cloud environments. The sheer volume of telemetry data produced outpaces human capacity for manual review.
What Is AIOps?
AIOps, or Artificial Intelligence for IT Operations, is the application of machine learning, big data analytics, and automation technologies to streamline, enhance, and accelerate IT operations and incident management.
Rather than acting as a replacement for monitoring systems, AIOps serves as an intelligence layer that sits on top of your existing tools. It ingests continuous streams of telemetry, applies mathematical algorithms to normalize and correlate the data, and orchestrates remediation workflows.
+-----------------------------------------------------------------------------------+
|                           Telemetry & Data Sources                                |
|             Logs  |  Metrics  |  Distributed Traces  |  Topology Maps             |
+-----------------------------------------+-----------------------------------------+
                                          |
                                          v
+-----------------------------------------------------------------------------------+
|                               AIOps Intelligence                                  |
|   Anomaly Detection  |  Event Correlation  |  Pattern Matching  |  RCA Inference  |
+-----------------------------------------+-----------------------------------------+
                                          |
                                          v
+-----------------------------------------------------------------------------------+
|                          Actionable Operations Layer                              |
|       Noise Reduction  |  Contextual Incidents  |  Automated Runbooks             |
+-----------------------------------------------------------------------------------+
Key functional capabilities of AIOps include:
- Continuous Data Ingestion: Processing heterogeneous operational data across cloud and on-premises environments.
- Dynamic Anomaly Detection: Spotting unusual operational behavior without depending solely on hard-coded static rules.
- Automated Event Correlation: Clustering related alerts generated by dependent services into a single actionable incident record.
- Contextual Topology Mapping: Mapping relationships between physical hardware, virtual infrastructure, microservices, and business applications.
- Root-Cause Inference: Assisting engineers by suggesting probable contributing factors based on historical failure modes and system changes.
- Operational Automation: Executing safe, predefined scripts or runbooks to mitigate standard operational disruptions.
How AI Helps Detect IT Incidents Faster
AI enhances incident detection by rapidly processing telemetry at scale and identifying complex multi-system relationships that human operators cannot spot manually in real time.
       5 Core Pillars of AI-Powered Incident Detection
 ┌─────────────────────────────────────────────────────────┐
 │ 1. Real-Time Telemetry Processing (Logs, Metrics, Traces)│
 │ 2. Dynamic Machine Learning Anomaly Detection           │
 │ 3. Multi-Layer Event Correlation & Clustering           │
 │ 4. Intelligent Context-Aware Alert Prioritization       │
 │ 5. Historical Pattern Matching & Signature Recognition  │
 └─────────────────────────────────────────────────────────┘
Real-Time Data Analysis Across Telemetry Types
Modern production environments output vast volumes of operational data. AI algorithms process this stream continuously across four primary telemetry categories:
- Metrics: Time-series performance indicators like CPU usage, IOPS, latency, and memory footprint.
- Logs: Timestamped text records generated by operating systems, containers, application runtimes, and web servers.
- Distributed Traces: End-to-end request journeys traversing microservices and third-party APIs.
- Configuration and Topology Events: Metadata tracking CI/CD deployments, auto-scaling events, and network routing updates.
By analyzing these diverse streams simultaneously, AI evaluates operational telemetry in context rather than reviewing individual metrics in isolation.
Dynamic Anomaly Detection
Traditional monitoring triggers alerts when a metric crosses an arbitrary fixed boundary. In contrast, machine learning models establish dynamic baselines that account for normal system fluctuations, such as diurnal traffic trends, seasonal retail cycles, and scheduled batch jobs.
Metric
Value
  ^
  |        Normal Traffic Peak (No False Alarm)
  |              / \                  Unusual Latency Spike (Anomaly Detected!)
  |             /   \                      ▲
  |   /\       /     \       /\           / \
  |  /  \_____/       \_____/  \_________/   \
  +---------------------------------------------> Time
     [...... Dynamic Baseline Envelope ......]
Practical Example:
Consider an API endpoint that normally handles 5,000 requests per minute on Monday mornings with an average response time of 80 milliseconds. If latency climbs to 450 milliseconds while transaction volume drops by 60%, a statistical anomaly detection model flags this deviation immediately.
Because the baseline adjusts dynamically according to historical day-of-week and time-of-day trends, the model detects the issue right away—without generating a false alarm during scheduled low-traffic weekend periods.
Multi-Signal Event Correlation
When a core infrastructure dependency degrades, it creates an alert storm across downstream services.
Instead of routing twenty separate tickets to twenty engineers, AI correlation engines analyze temporal proximity, network topology, and inter-service dependencies. The system identifies that an application error spike, a message queue backlog, and an API timeout all stem from an upstream database index lock. The correlated signals are rolled into a single incident record.
Intelligent Alert Prioritization
Not all alerts carry the same operational urgency. An unexpected spike in memory usage on a staging server requires attention, but an authentication failure on a production payment gateway demands immediate escalation.
AI models assess system topology, active user impact, and business tiering to score and prioritize alerts, ensuring on-call responders focus on high-impact disruptions first.
Pattern Recognition
By comparing active telemetry with historical incident archives, AI systems recognize recurring failure signatures. If an application begins demonstrating the exact metric degradation pattern that preceded an out-of-memory crash three weeks prior, the system can flag the pattern before a catastrophic outage occurs.
AI vs. Traditional Rule-Based Monitoring
To understand how modern operations have evolved, consider this direct comparison between traditional rule-based monitoring and an AI-driven approach:
| Capability Area | Traditional Rule-Based Monitoring | AI & AIOps Approach |
| Detection Method | Relies on hardcoded, static thresholds (e.g., CPU > 85%). | Employs dynamic baselines and multi-variate machine learning models. |
| Alerting Behavior | Fires independent alerts for each breached threshold. | Aggregates and groups related alerts into unified incidents. |
| Event Correlation | Manual; relies on tribal knowledge and ad-hoc log querying. | Automated; uses topological graphs, time-series alignment, and heuristics. |
| Anomaly Detection | Limited to basic boundary breaches; prone to high false-positive rates. | Context-aware; factors in seasonality, release cadences, and business hours. |
| System Context | Isolated metric views without infrastructure relationship data. | Ingests topology maps to trace service dependencies end-to-end. |
| Scalability | High maintenance overhead; requires manual rule tuning per service. | Scales across ephemeral containers and distributed architectures automatically. |
| Historical Analysis | Basic descriptive reporting and threshold comparisons. | Predictive trend analysis, pattern matching, and signature recognition. |
| Incident Investigation | Responders manually query log aggregators and correlate dashboards. | Delivers contextual summaries, timeline reconstructions, and probable causes. |
Note: AI does not render traditional monitoring obsolete. Simple, definitive threshold rules (such as a hard ping failure or a process crash) remain essential, cost-effective baseline checks. AI complements these rules by handling complex, multi-system telemetry patterns.
The Role of Observability in Faster Incident Detection
Artificial intelligence is only as effective as the underlying data it ingests. In modern IT environments, observability provides the structured telemetry foundation required for accurate AI analysis.
       The Observability-to-Resolution Value Chain
┌─────────────┐     ┌───────────────┐     ┌─────────────┐
│  Telemetry  │ ──> │ Observability │ ──> │ AI Analysis │
│  (M, E, L,T)│     │ (System State)│     │  (Patterns) │
└─────────────┘     └───────────────┘     └─────────────┘
                                                 │
                                                 v
┌──────────────┐     ┌───────────────┐     ┌─────────────┐
│  Resolution  │ <── │ Investigation │ <── │  Detection  │
│  & Learning  │     │   (Context)   │     │  (Incidents)│
└─────────────┘     └───────────────┘     └─────────────┘
While monitoring tells you when a specific metric crosses a line, observability provides the internal system state visibility needed to understand why complex software behaves in unexpected ways.
Effective AIOps platforms require robust observability across five key data pillars:
- Detailed Metric Streams: Providing high-resolution time-series performance data across every service tier.
- Structured Log Data: Ingesting standardized JSON logs containing environment metadata, error stack traces, and request IDs.
- End-to-End Distributed Tracing: Capturing request execution paths across microservices, serverless components, and datastores.
- Topological Service Dependency Maps: Maintaining an up-to-date graph of how services, host machines, networks, and containers communicate.
- Real-User and Synthetic Telemetry: Tracking digital user experience indicators like Core Web Vitals, page rendering latencies, and conversion drops.
If the incoming telemetry is fragmented, missing trace IDs, or poorly timestamped, AI models will struggle with blind spots and hallucinated correlations. Clean, reliable observability data is an essential prerequisite for faster, automated incident detection.
How AI Reduces Alert Fatigue
Alert fatigue is one of the biggest challenges facing modern DevOps and SRE teams. When on-call engineers receive hundreds of non-critical, redundant notifications each shift, reaction times slow down, stress levels rise, and critical outages get missed.
AIOps platforms combat alert fatigue using a structured reduction pipeline:
[ Raw Alert Stream: 1,000s/day ]
              │
              ▼
  [ Step 1: Deduplication ]        ──> Removes identical, repeating pings
              │
              ▼
  [ Step 2: Temporal Grouping ]    ──> Bundles alerts firing within the same window
              │
              ▼
  [ Step 3: Topological Mapping ]  ──> Connects alerts across parent-child dependencies
              │
              ▼
  [ Step 4: Context Enrichment ]   ──> Attaches relevant logs, metrics, and git commits
              │
              ▼
[ Actionable Incidents: 5-10/day ] ──> Routed directly to the responsible team
- Alert Deduplication: Stripping out identical, repetitive alert occurrences generated by the same failing component over short timeframes.
- Intelligent Event Grouping: Grouping alerts that share identical root dependencies or fire within the same operational time window.
- Noise Filtering: Using machine learning to suppress known benign alerts during maintenance windows or standard batch workloads.
- Context Enrichment: Attaching diagnostic metadata—such as recent code commits, active runbooks, and relevant log lines—directly to the primary alert notification.
The goal is not to hide operational data. Instead, AIOps transforms raw, overwhelming alert streams into a curated set of actionable incidents.
AI-Powered Root Cause Analysis (RCA)
Detecting an incident quickly is valuable, but resolving it requires understanding why the failure occurred. AI assists root cause analysis by correlating anomalies across system boundaries and tracing operational dependencies back to their likely origin.
+------------------------------------------------------------------+
|                   AI Correlation & RCA Engine                    |
+------------------------------------------------------------------+
  [ CI/CD Pipeline ]         ──> Recent production build deployed 12 mins ago
  [ Configuration State ]    ──> Database connection pool capped at 20
  [ Metric Ingestion ]       ──> Worker thread latency climbed immediately after
  [ Error Logs ]             ──> "Connection Timeout" logged across API instances
+------------------------------------------------------------------+
                                  │
                                  ▼
+------------------------------------------------------------------+
|                  Generated RCA Hypothesis:                       |
|   "Deployment v2.4.1 reduced DB pool size, causing API timeout   |
|    cascade under current load. Confidence Score: 91%"            |
+------------------------------------------------------------------+
When an incident occurs, the AI correlation engine evaluates several operational dimensions:
- Change Intelligence: Checking whether a recent configuration change, Kubernetes manifest update, or CI/CD deployment correlates with the initial point of failure.
- Dependency Traversal: Walking the topological dependency graph upstream from the failing user-facing service to identify the earliest point of degradation.
- Log Pattern Clustering: Grouping thousands of unique error logs into common message templates using Natural Language Processing (NLP) to surface new or rare error signatures.
- Cross-Tier Anomaly Alignment: Aligning CPU spikes, network retransmits, and memory usage changes along a unified timeline.
Crucial Reality Check: AI models provide probabilistic hypotheses, not absolute certainty. They help human engineers zero in on likely culprits faster, but final conclusions must always be verified by an engineer.
Predictive Incident Detection
Traditional monitoring is inherently reactive—it alerts you after a system has degraded or broken. AI introduces proactive and predictive capabilities, identifying subtle leading indicators before an outage impacts end users.
Reactive vs. Proactive Incident Detection

REACTIVE:
Normal Operation ──> [ Outage Occurs ] ──> Alert Fires ──> Human Responds ──> Fix
                                                ^ (Downtime Experienced)

PROACTIVE (AI-Assisted):
Normal Operation ──> [ Micro-Anomaly Detected ] ──> Early Warning ──> Proactive Fix
                            ^ (No User Impact Yet)
By analyzing historical performance data and long-term trend lines, machine learning algorithms spot patterns that precede system failures:
- Memory Saturation Forecasting: Detecting linear memory growth in a microservice to flag an impending Out-Of-Memory (OOM) crash hours before it occurs.
- Disk Capacity Depletion: Forecasting storage exhaustion on transaction logs based on real-time write rates and disk space trends.
- Queue Consumer Starvation: Identifying gradual backpressure in message queues before downstream processing jobs stall.
- Slow-Burn Latency Degradation: Spotting creeping degradation in external third-party API dependencies before request queues back up.
These predictive insights are probabilistic. They indicate a high likelihood of failure based on historical models, giving operations teams a window of opportunity to intervene proactively before an incident causes actual downtime.
AI and Incident Prioritization
During a widespread infrastructure disruption, dozens of services may experience issues simultaneously. In these high-pressure scenarios, responding teams must understand which incidents to address first based on business impact.
       AI Dynamic Incident Prioritization Engine
┌────────────────────────────────────────────────────────┐
│  Inputs:                                               │
│   • Core Revenue Impact (Checkout vs Internal Wiki)    │
│   • Active User Volume Experiencing Errors             │
│   • SLA / SLO Burn Rate Velocity                       │
│   • Dependency Criticality (Tier-0 vs Tier-3 Service)  │
└──────────────────────────┬─────────────────────────────┘
                           │
                           ▼
┌────────────────────────────────────────────────────────┐
│  Output: Dynamically Assigned Priority & Routing       │
│   [ P1 - CRITICAL ]: Payment Gateway Timeout (Engaged) │
│   [ P3 - LOW      ]: Internal Metric Collector Lag     │
└────────────────────────────────────────────────────────┘
AI systems calculate dynamic priority scores by evaluating multiple factors:
- Service Criticality: Weighing issues based on whether they affect customer-facing revenue pathways (Tier-0 services) or non-essential internal tools.
- User Impact Breadth: Estimating the real-world volume of end users receiving error responses.
- SLO Burn Rate: Calculating how quickly an active anomaly is consuming the service’s monthly Error Budget.
- Blast Radius: Analyzing the service topology map to determine whether an issue is isolated or likely to cascade into dependent systems.
Automated prioritization ensures engineering resources are focused on the most critical operational risks first.
How AI Supports Incident Response
Incident detection is only the first step in the operational lifecycle. Once an incident is identified, AIOps platforms support responders across the entire triage-to-resolution workflow.
[ Detect ] ──> [ Contextualize ] ──> [ Route ] ──> [ Triage ] ──> [ Remediate ] ──> [ Learn ]
A modern AIOps workflow assists engineers at every stage:
- Incident Creation and Routing: Automatically generating an incident ticket enriched with metrics, topology context, and blast-radius estimations, then routing it to the team owning the impacted service.
- Diagnostic Data Gathering: Running automated diagnostic queries—such as fetching thread dumps, recent stack traces, and active deployment diffs—and appending the findings directly to the incident record.
- Runbook Automation: Suggesting or triggering approved automation scripts (such as restarting a stalled worker node, clearing cache pools, or rolling back a bad canary deployment).
- Stakeholder Communication: Generating human-readable incident summaries for status dashboards, keeping cross-functional teams aligned without pulling lead engineers away from troubleshooting.
- Post-Incident Analysis: Compiling unified incident timelines, metric charts, and event sequences to streamline the post-mortem review process.
Safety Principle: High-impact remediation actions (such as dropping database tables or provisioning new cloud regions) should always require human authorization to prevent automated misconfigurations.
Hypothetical Walkthrough: Detecting a Production Incident
To see how these concepts work in practice, let’s walk through a realistic, hypothetical production scenario:
Step 1: 14:00 ──> Deployment of Checkout Service (v3.2.1)
Step 2: 14:04 ──> DB Connection Pool Contention Begins
Step 3: 14:06 ──> AI Anomaly Model Detects Latency Divergence
Step 4: 14:07 ──> Downstream API Timeouts Correlated into Single Incident
Step 5: 14:08 ──> Probable Cause Highlighted: v3.2.1 DB Pool Misconfiguration
Step 6: 14:10 ──> SRE Validates Hypothesis & Triggers Automated Canary Rollback
Step 7: 14:12 ──> Latency Returns to Baseline; Incident Resolved
- 14:00 – Deployment: A new version of an e-commerce checkout service (
v3.2.1) is deployed to production. - 14:04 – Early Degradation: A subtle configuration bug causes database connections to remain open longer than intended. Legacy static thresholds (set at 90% CPU) remain un-triggered because host resources appear normal.
- 14:06 – Dynamic Anomaly Detection: The AIOps engine detects that database response latencies have deviated by 3.5 standard deviations from the historical Monday afternoon baseline, accompanied by an unexpected dip in completed checkout transactions.
- 14:07 – Correlation Engine Engaged: As downstream payment microservices begin logging HTTP 504 gateway timeouts, the AI engine links these downstream errors to the initial database connection pool exhaustion, grouping 45 incoming alerts into a single P1 incident.
- 14:08 – Incident Enrichment: The AIOps system creates an incident ticket, flags the
v3.2.1deployment from 8 minutes prior, highlights the connection pool exhaustion, and notifies the on-call SRE team. - 14:10 – Verification and Mitigation: The on-call SRE reviews the AI-generated timeline, confirms the configuration bug in
v3.2.1, and approves an automated rollback runbook. - 14:12 – Recovery: The service rolls back to
v3.2.0, connection pools normalize, checkout latency drops back within baseline limits, and the incident is marked resolved.
In this scenario, AI helped the team detect, diagnose, and resolve the incident in 12 minutes—well before static thresholds would have sounded alarms or customer complaints began overwhelming the support desk.
AI for Cloud and Multi-Cloud Incident Detection
Managing modern infrastructure across hybrid, private, and multi-cloud environments (AWS, Microsoft Azure, Google Cloud, on-premises datacenters) introduces significant operational complexity.
+------------------------------------------------------------------------------------+
|                         Distributed Multi-Cloud Stack                              |
|   AWS Microservices   |   GCP BigQuery Jobs   |   On-Premises Legacy Databases     |
+-----------------------------------------+------------------------------------------+
                                          |
                                          v
+------------------------------------------------------------------------------------+
|                      AIOps Normalized Data Fabric Layer                            |
|             Unified Ingestion  |  Cross-Cloud Topology  |  Global Tracing          |
+------------------------------------------------------------------------------------+
These environments present unique operational challenges:
- Ephemeral Compute: Serverless functions and Kubernetes pods often live for only minutes or seconds, generating brief bursts of telemetry before terminating.
- Cross-Cloud Network Latencies: Applications spanning on-premises databases and public cloud compute layers can suffer from intermittent inter-cloud network bottlenecks.
- Fragmented Cloud-Native Tooling: Relying on separate, native monitoring tools for each cloud provider creates visibility silos that make end-to-end troubleshooting difficult.
AIOps platforms bridge these gaps by normalizing telemetry across cloud boundaries into a unified data model. By mapping topology across diverse cloud providers, AI engines trace transaction flows and detect performance bottlenecks regardless of where individual components run.
The Real-World Benefits of Faster Incident Detection
Adopting AI-driven incident detection delivers concrete operational and organizational improvements across IT teams:
- Lower Mean Time to Detect (MTTD): Identifying subtle anomalies and system degradations before they escalate into full-scale outages.
- Accelerated Triage and Mean Time to Resolve (MTTR): Delivering pre-correlated alerts and diagnostic context directly to incident responders, eliminating manual triage delays.
- Reduced Alert Fatigue: Filtering out operational noise and deduplicating alerts so engineers can focus on critical, actionable issues.
- Improved Engineering Productivity: Freeing SRE and DevOps professionals from repetitive firefighting so they can focus on proactive architecture and core development.
- Protected Revenue and Service Availability: Minimizing application downtime and maintaining consistent service reliability to protect customer satisfaction and brand trust.
16. Challenges and Limitations of AI-Based Detection
While AIOps brings powerful capabilities to IT operations, it is not a magic fix for underlying architectural problems. Engineering leaders must navigate several practical challenges:
Common AIOps Implementation Pitfalls
 ├── Garbage In, Garbage Out  ──> Poor telemetry leads to inaccurate models
 ├── False Positives / Negatives ──> Overly sensitive or poorly tuned anomaly models
 ├── Concept & Model Drift     ──> CI/CD changes alter baseline operational patterns
 ├── Black Box Interpretability──> Engineers distrust alerts with opaque reasoning
 └── Over-Reliance on Automation─> Automated scripts running without safeguards
- Data Quality Bottlenecks: Machine learning models depend on clean, well-structured telemetry. Missing log fields, inconsistent timestamps, or un-instrumented services will degrade the quality of AI insights.
- False Positives and Negatives: Anomaly detection models that are too sensitive generate distracting false alarms, while models tuned too conservatively can miss real, subtle degradations.
- Model and Concept Drift: As new features deploy, architecture evolves, and user traffic grows, historical baselines become outdated. Machine learning models require regular recalibration to maintain accuracy.
- The “Black Box” Trust Problem: If an AIOps platform alerts an engineer to a critical issue without showing why it reached that conclusion, the team will hesitate to act. Explainability and clear diagnostic context are essential for building trust.
- Automation Safety Risks: Executing automated remediation scripts without proper policy guardrails, permission boundaries, and safety checks can turn a minor glitch into a broader outage.
10 Best Practices for Implementing AI-Based Incident Detection
Organizations looking to implement AI-powered incident detection should follow these ten practical, field-tested best practices:
            10 Practical Steps to AIOps Success
 1. Define Clear Objectives     ──> Focus on concrete pain points (e.g., MTTD)
 2. Clean Up Telemetry           ──> Standardize JSON logs, metrics, and trace IDs
 3. Centralize Your Data         ──> Ingest telemetry into a unified analysis layer
 4. Establish Dynamic Baselines  ──> Train models across representative traffic cycles
 5. Deduplicate Low-Value Noise  ──> Eliminate redundant alerts at the source
 6. Build Topological Maps       ──> Maintain accurate service dependency graphs
 7. Enrich Incident Context      ──> Attach runbooks, logs, and commit data to alerts
 8. Keep Humans in the Loop      ──> Require manual approval for high-risk actions
 9. Review Detection Accuracy    ──> Continuously audit false alarms and missed events
10. Adopt an Iterative Approach  ──> Start with one critical service before scaling
- Define Clear Operational Goals: Focus on specific, measurable objectives—such as cutting alert noise by 50% or reducing incident MTTD on a critical customer pathway—rather than attempting a generic “AI transformation.”
- Audit and Standardize Telemetry: Ensure application logs use consistent JSON formatting, timestamps are synchronized via NTP, and distributed traces carry continuous correlation IDs across services.
- Centralize Operational Data Streams: Consolidate telemetry into an integrated observability and AIOps platform to eliminate visibility silos between engineering teams.
- Train Baselines on Clean Data: Allow machine learning models to observe system behavior across several business cycles (including normal business days, weekends, and peak hours) before relying on dynamic thresholds.
- Eliminate Redundant Alerts at the Source: Clean up obsolete, non-actionable legacy alerts before feeding alert streams into AI correlation engines.
- Maintain Accurate Service Topology Maps: Integrate your service discovery systems, CI/CD pipelines, and cloud registry metadata to give the AI engine an up-to-date map of service dependencies.
- Enrich Alerts with Actionable Context: Automatically attach deployment diffs, active runbooks, and recent error logs directly to alert payloads to speed up triage.
- Keep Humans in the Loop for Critical Actions: Require explicit human approval for automated actions that could impact production availability, such as rolling back databases or terminating critical compute instances.
- Audit AI Outputs Regularly: Establish a feedback loop where engineers can mark alerts as helpful, false-positive, or misclassified to help tune model parameters over time.
- Start Small and Iterate: Implement AIOps on a single well-understood, high-volume service to validate detection accuracy before rolling it out across your entire enterprise architecture.
Key Metrics for Measuring Incident Detection Performance
To evaluate whether an AIOps implementation is successfully improving operational efficiency, track these key performance indicators (KPIs) over time:
| Metric Name | Full Term | Operational Meaning & Value |
| MTTD | Mean Time to Detect | The average time elapsed from the actual start of a system failure to its detection by monitoring tools or engineers. |
| MTTA | Mean Time to Acknowledge | The average time taken by an on-call engineer to acknowledge an incoming incident notification. |
| MTTR | Mean Time to Resolve / Restore | The average time required to troubleshoot, fix, and restore an impacted service back to normal operation. |
| Alert Noise Ratio | Alert Reduction Rate | The percentage reduction in raw alert volume achieved after applying deduplication, filtering, and grouping. |
| FPR | False Positive Rate | The percentage of generated alerts that represent benign, non-actionable, or incorrect anomaly detections. |
| Incident Recurrence | Repeat Incident Rate | The frequency with which identical failure signatures repeat across the same service over a given timeframe. |
| Service Availability | Uptime & SLO Compliance | The overall percentage of time that customer-facing systems meet agreed-upon reliability objectives. |
Focus Note: While MTTD is a critical metric for tracking detection speed, it should always be evaluated alongside MTTR, False Positive Rates, and Service Availability to ensure the team is improving overall system resilience.
How IT Teams Can Get Started with AIOps
Adopting AIOps does not require replacing your entire monitoring stack overnight. Organizations achieve the best results by following a gradual, step-by-step roadmap:
AIOps Implementation Roadmap
  Step 1: Pick a High-Value Service
    └── Identify a critical customer pathway with frequent alert noise
  Step 2: Consolidate Monitoring Telemetry
    └── Ingest logs, metrics, and traces into a centralized platform
  Step 3: Enable Dynamic Anomaly Baselines
    └── Replace fragile static thresholds on core service metrics
  Step 4: Configure Event Correlation
    └── Group downstream alerts using service dependency mapping
  Step 5: Measure, Refine, and Automate
    └── Track MTTD gains and safely introduce approved runbook automations
- Step 1: Identify a High-Value Pilot Candidate: Select one business-critical microservice or application that generates significant alert volume and has well-understood architecture.
- Step 2: Consolidate and Normalize Telemetry: Ensure the pilot application outputs consistent, structured logs, comprehensive distributed traces, and key time-series metrics into a central analysis layer.
- Step 3: Deploy Machine Learning Anomaly Detection: Implement dynamic baselines on critical metrics (such as latency, error rates, and transaction throughput) to replace brittle, static threshold rules.
- Step 4: Enable Event Grouping and Correlation: Group alerts firing across upstream and downstream dependencies into unified incident records to streamline responder handoffs.
- Step 5: Review Metrics and Expand Automation: Measure improvements in MTTD and alert noise reduction. Once the detection models prove reliable, gradually introduce safe, automated remediation runbooks for well-understood, repetitive issues.
20. The Role of TheAIOps.com
As enterprise systems grow more distributed, keeping up with best practices in artificial intelligence, observability, and modern site reliability engineering can be challenging.
TheAIOps.com serves as an educational knowledge hub designed for SREs, DevOps engineers, IT operations professionals, and systems architects navigating this transition.
The platform provides practical, actionable insights focused on real-world engineering challenges:
- Proactive Incident Detection: Exploring how machine learning algorithms identify complex failure modes before customer experience degrades.
- Alert Noise Reduction & Event Correlation: Evaluating techniques for turning high-volume alert storms into clean, actionable incident contexts.
- Observability Architecture: Deep dives into OpenTelemetry standards, log structuring, metric ingestion pipelines, and distributed tracing.
- Root Cause Analysis & Diagnostics: Practical strategies for mapping service topologies, tracking configuration changes, and accelerating triage.
- Safe Operational Automation: Guidance on building secure, human-in-the-loop automation workflows that reduce operational toil without compromising stability.
Whether you are an experienced architect refining an enterprise monitoring strategy or an engineer exploring AIOps fundamentals for the first time, TheAIOps.com provides practical, field-tested resources to help modern teams build more resilient systems.
The Future of AI-Powered Incident Detection
The intersection of artificial intelligence and IT operations continues to advance rapidly. Over the coming years, several emerging capabilities will reshape how teams maintain system reliability:
                      The Evolution of AIOps
  Past (Static Rules)      Present (AIOps & Correlation)      Future (Agentic Ops)
 ┌────────────────────┐    ┌───────────────────────────┐    ┌───────────────────────────┐
 │ • Fixed thresholds │ ──>│ • Dynamic baselines       │ ──>│ • Specialized AI agents   │
 │ • Manual triage    │    │ • Automated correlation   │    │ • Auto-generated postmortems│
 │ • Siloed dashboards│    │ • Contextual enrichment   │    │ • Verified autonomous fixes │
 └────────────────────┘    └───────────────────────────┘    └───────────────────────────┘
- Generative AI for Incident Triage: Large Language Models (LLMs) are beginning to parse thousands of complex log lines and configuration files during outages, generating clear natural-language incident summaries for responding engineers.
- Specialized AI Operations Agents: Autonomous, domain-specific AI agents can run diagnostic commands, query database logs, cross-reference past postmortems, and present structured remediation options to on-call engineers.
- Intelligent Observability Pipelines: Machine learning models embedded directly within telemetry pipelines can filter, summarize, and route low-value log data at the edge, significantly reducing data storage costs while preserving critical anomalies.
- Predictive Infrastructure Optimization: Advanced time-series models will predict infrastructure bottlenecks days in advance, automatically rightsizing cloud resources and updating database configurations ahead of anticipated load spikes.
Governance and Safety: As IT operations automation becomes more sophisticated, organizations must maintain strong engineering discipline. Transparent model explainability, strict role-based access controls (RBAC), comprehensive audit logs, and human approval for critical operations will remain vital safeguards for production stability.
Frequently Asked Questions (FAQs)
How does AI detect IT incidents?
AI detects IT incidents by continuously analyzing operational telemetry—such as metrics, logs, traces, and system events.
Machine learning models establish dynamic baselines of normal behavior and flag statistically significant deviations (anomalies) in real time. Advanced correlation engines then group related anomalies across services into a single unified incident, identifying issues faster than manual dashboard reviews can.
What is AIOps incident detection?
AIOps incident detection is the practice of using artificial intelligence, machine learning, and big data analytics to automate the identification, grouping, and prioritization of IT operational issues.
Instead of relying on isolated, static alert rules, AIOps evaluates telemetry in context across the entire infrastructure to surface meaningful incidents early.
How does AI reduce alert fatigue?
AI reduces alert fatigue by deduplicating identical alerts, filtering out benign background noise, and grouping related notifications from dependent services into a single incident record.
By enriching alerts with diagnostic context and assigning priority scores based on business impact, AI helps engineers focus on actionable issues rather than sifting through hundreds of isolated alarms.
What is anomaly detection in AIOps?
Anomaly detection in AIOps is the algorithmic process of identifying data points or metric trends that deviate significantly from established normal operational patterns.
Unlike static threshold checks, machine learning anomaly detection automatically adapts to time-of-day traffic patterns, seasonal usage shifts, and deployment cycles, minimizing false alarms during benign operational changes.
How does event correlation help IT teams?
Event correlation links multiple related alerts and system events originating from different infrastructure components to a single underlying root problem.
For example, if an upstream database failure causes downstream API timeouts and frontend error spikes, event correlation rolls those symptoms into one incident, preventing multiple teams from troubleshooting the same issue in isolation.
Can AI predict IT incidents?
AI can predict certain classes of IT incidents by analyzing historical operational patterns and identifying early warning signs—such as gradual memory leaks, creeping disk saturation, queue backpressure, or degrading third-party API response times.
While these predictions are probabilistic rather than guaranteed, they give engineering teams a valuable window to intervene before systems experience full outages.
How does AIOps help with root cause analysis?
AIOps accelerates root cause analysis by cross-referencing recent code deployments, configuration updates, and infrastructure changes with active error spikes.
By tracing topological service dependencies and clustering anomalous log patterns using NLP, AIOps platforms highlight likely contributing factors to help engineers isolate the root cause faster.
What is the difference between monitoring and AIOps?
Traditional monitoring tools track and display specific metrics against static rules, notifying engineers when a particular threshold is breached (answering “what is broken right now?”).
AIOps acts as an intelligence layer on top of monitoring and observability data, analyzing multi-system patterns, correlating events, reducing noise, and providing contextual insight (answering “why did this happen and what is the broader impact?”).
What metrics measure incident detection performance?
The most common metric for measuring detection speed is Mean Time to Detect (MTTD), which tracks the time elapsed between an issue’s inception and its identification.
Other essential metrics include Mean Time to Acknowledge (MTTA), Mean Time to Resolve (MTTR), Alert Reduction Rate, False Positive Rate, and overall Service Availability.
How can beginners learn AIOps?
Beginners should start by mastering the fundamentals of IT observability—focusing on metrics, logs, distributed traces, and service topologies.
From there, explore basic time-series anomaly detection, event correlation patterns, and modern incident management practices. Educational resources, architectural breakdowns, and engineering guides on TheAIOps.com provide an accessible, practical starting point for building this expertise.
Conclusion
Modern distributed architectures have grown too fast-paced and complex for manual, threshold-based monitoring alone. When an outage occurs, on-call engineers cannot afford to spend critical minutes manually querying logs, cross-referencing disconnected dashboards, and wading through noisy alert storms. By applying artificial intelligence and machine learning to operational data, AIOps transforms incident detection. It analyzes telemetry in real time, isolates meaningful anomalies from routine fluctuations, correlates downstream symptoms to upstream dependencies, and delivers clear, contextual insights directly to responders. Faster incident detection is not about replacing human engineers—it is about empowering them with the clarity and actionable context needed to resolve issues quickly, reduce downtime, and maintain reliable systems.
