Upgrade & Secure Your Future with DevOps, SRE, DevSecOps, MLOps!
We spend hours scrolling social media and waste money on things we forget, but won’t spend 30 minutes a day earning certifications that can change our lives.
Master in DevOps, SRE, DevSecOps & MLOps by DevOps School!
Learn from Guru Rajesh Kumar and double your salary in just one year.
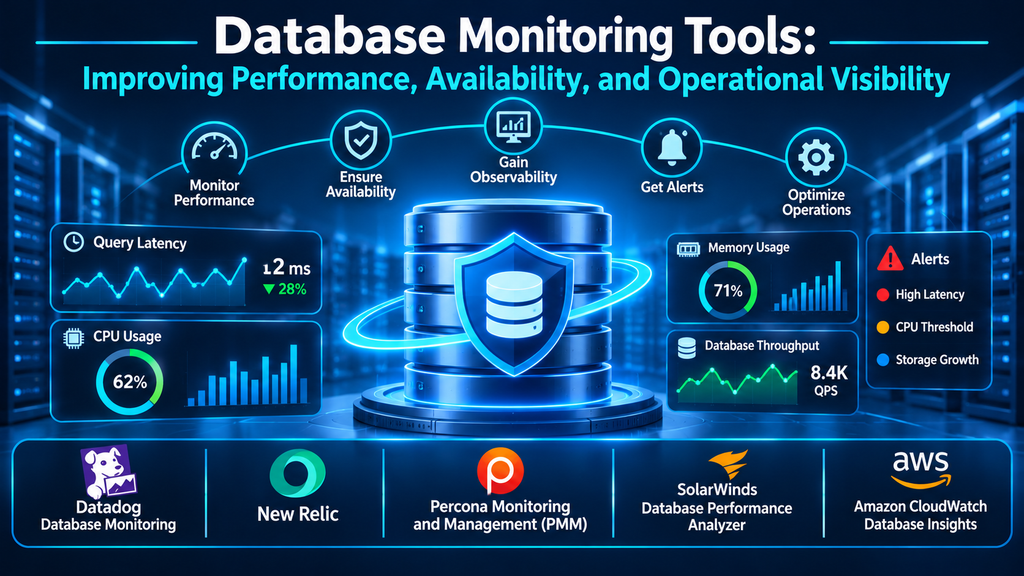
Database Monitoring Tools: Improving Performance, Availability, and Operational Visibility
Database monitoring tools help teams understand how database systems behave under real workloads. They track performance, resource utilization, query execution, availability, errors, and operational events so administrators can identify bottlenecks before they become outages.
The category is broader than a single product type. Some tools provide deep query analytics for specific database engines; others correlate database behavior with application performance, infrastructure metrics, and cloud services. Choosing the right approach starts with understanding what needs to be monitored and how teams will act on the information.
What Database Monitoring Tools Actually Monitor
Database monitoring combines several types of telemetry:
- Query performance: Execution time, query volume, slow queries, execution plans, and resource consumption.
- Database health: Connections, sessions, locks, deadlocks, replication, cache activity, and database errors.
- Infrastructure utilization: CPU, memory, disk I/O, storage capacity, and network activity.
- Availability: Instance status, failovers, service interruptions, and recovery behavior.
- Workload patterns: Changes in transaction volume, concurrent sessions, read/write ratios, and workload distribution.
- Wait events: Time spent waiting for locks, storage, network operations, or other database resources.
- Alerting and trends: Threshold violations, anomalies, historical comparisons, and capacity trends.
A monitoring platform should help teams move from an alert to an explanation. Knowing that query latency increased is useful; identifying the query, wait event, host, deployment, or application change responsible is much more actionable.
Database Monitoring Tools and Platforms to Evaluate
| Tool or platform | Main strength | Suitable evaluation scenario |
|---|---|---|
| Datadog Database Monitoring | Query-level metrics, samples, explain plans, and infrastructure correlation | Teams using a broader observability platform |
| New Relic Database monitoring | Query performance analysis and application-performance correlation | Teams investigating database impact on application response times |
| Percona Monitoring and Management (PMM) | Open-source database observability and query analytics | MySQL, PostgreSQL, and MongoDB environments |
| SolarWinds Database Performance Analyzer | Cross-platform database performance analysis | Organizations monitoring multiple database engines |
| Amazon CloudWatch Database Insights | AWS database load analysis and performance troubleshooting | Applications using Amazon RDS |
These products have different scopes and deployment assumptions. A cloud-native monitoring service may be convenient for a managed database estate, while an open-source platform may offer more deployment control. A broad observability suite can be valuable when database symptoms must be correlated with application traces and infrastructure events.
Datadog Database Monitoring
Datadog Database Monitoring provides visibility into database health and query performance. Its documentation describes query metrics, query samples, explain plans, and the ability to group or filter performance information by infrastructure and tags.
Teams can use query metrics to identify statements consuming significant database time, examine latency trends, and investigate which hosts or services are associated with a workload. Datadog also supports correlation between database queries and application traces, helping engineers follow a slow application request to the database operation involved.
Datadog is worth evaluating when database monitoring needs to sit alongside infrastructure monitoring, application performance monitoring, logs, and alerting. Buyers should check supported database integrations, collection configuration, query visibility, retention requirements, and the volume of telemetry that will be collected.
Official resources: Datadog Database Monitoring and Exploring Query Metrics.
New Relic Database Monitoring
New Relic provides database performance monitoring and query analysis within its observability platform. Its documentation describes query analysis, query details, wait-time analysis, slow-query samples, and execution-plan information for supported integrations.
This can help database administrators investigate high execution times, resource consumption, blocking sessions, and wait events. When application performance data is available in the same environment, teams can use the relationship between application behavior and database activity to narrow down performance problems.
New Relic is a candidate for organizations that want database insights as part of a broader application observability workflow. Before selecting it, verify the supported database integrations, required instrumentation, query data collection behavior, and the level of detail available for the database versions in use.
Official resources: New Relic query performance monitoring and Database performance monitoring.
Percona Monitoring and Management
Percona Monitoring and Management (PMM) is an open-source database observability, monitoring, and management platform. Percona documents support for MySQL, PostgreSQL, and MongoDB, with dashboards and query analytics designed to help teams understand performance from cluster-level metrics down to individual queries.
PMM is especially relevant to organizations that want a self-managed monitoring option and detailed database-specific metrics. Its dashboards and Query Analytics can help identify expensive queries, examine database behavior, and investigate performance trends across supported environments.
Because PMM is self-managed, teams should plan the monitoring server, client deployment, storage, upgrades, access controls, and availability of the monitoring system itself. Its database coverage is focused rather than universal, so organizations with many different engines should confirm whether additional monitoring tools are needed.
Official resources: Percona Monitoring and Management documentation and PMM overview.
SolarWinds Database Performance Analyzer
SolarWinds Database Performance Analyzer (DPA) is designed for database performance monitoring and analysis across supported database platforms and cloud or on-premises environments. SolarWinds describes capabilities for query performance monitoring, analysis, tuning, and anomaly detection.
DPA is worth considering when database teams need a dedicated performance analysis tool across multiple database systems. Its value should be assessed through the depth of its wait-time analysis, query diagnostics, supported database versions, historical data, and ability to help administrators identify the source of performance bottlenecks.
Organizations should also review deployment requirements, licensing, integrations, and the operational effort required to monitor a large database estate.
Official resource: SolarWinds Database Performance Analyzer.
Amazon CloudWatch Database Insights
Amazon CloudWatch Database Insights provides database performance visibility for supported Amazon RDS environments. AWS documentation describes database load analysis using average active sessions and the ability to examine load by dimensions such as SQL statements, wait events, hosts, and users.
This is useful for teams operating databases on AWS that want performance investigation integrated with the AWS monitoring environment. Database load analysis can help identify whether database activity is dominated by particular statements, users, or wait categories.
Its suitability depends on the RDS engines and configuration in use, the required level of detailed metrics, and the AWS monitoring features enabled. It should not be assumed to provide identical coverage for databases running outside the supported AWS services.
Official documentation: Amazon CloudWatch Database Insights for RDS.
Key Database Performance Metrics to Track
A useful monitoring strategy focuses on metrics that explain database behavior rather than collecting every available counter without a purpose.
Query latency and execution time
Query latency measures how long database operations take. Average latency can reveal broad trends, but averages can hide occasional severe delays. Track percentiles such as p95 and p99 where supported, and examine slow-query samples to understand the experience of slower requests.
Throughput and query volume
Queries per second, transactions per second, and read/write activity help teams understand workload volume. A sudden rise may be expected during a business event, or it may indicate a retry loop, inefficient application behavior, or unexpected traffic.
CPU and memory utilization
High CPU utilization can result from expensive queries, concurrency, inefficient execution plans, or insufficient capacity. Memory pressure may affect caching and increase disk activity. Interpret these metrics alongside query and wait-event data rather than treating a high percentage as proof of a database problem.
Disk I/O and storage
Monitor read and write operations, I/O latency, storage utilization, and growth trends. Storage bottlenecks can increase query response times even when CPU utilization appears moderate.
Connections and concurrency
Connection counts, active sessions, connection wait time, and connection-pool behavior can reveal overload or inefficient application connection management. Too many concurrent sessions may consume resources and increase contention.
Locks, blocking, and deadlocks
Blocking occurs when one operation must wait for another to release a resource. Deadlocks arise when transactions create a cycle of dependencies that cannot proceed. Monitoring these events helps teams identify transaction patterns and application behavior that need attention.
Replication and availability
For replicated environments, monitor replication lag, replica health, failover events, and synchronization status. A database may respond normally to local queries while replicas are falling behind, creating stale reads or recovery risks.
Database Monitoring vs. Database Observability
Monitoring generally focuses on known indicators and predefined conditions: CPU usage, connection counts, slow queries, storage capacity, and availability. It answers questions such as whether a metric has crossed a threshold or whether a database is healthy according to an established rule.
Observability goes further by helping teams investigate unfamiliar problems through connected telemetry. It combines metrics with query samples, logs, traces, execution plans, infrastructure data, and workload context. This makes it easier to explore why a system behaves unexpectedly, even when the exact failure mode was not anticipated in advance.
The distinction is not absolute. Modern database monitoring platforms increasingly include observability features. The practical question is whether the tool provides enough context to move from detection to root-cause analysis.
How to Choose the Right Database Monitoring Tool
Start by listing the database engines, versions, deployment models, and environments that need coverage. Include production, staging, development, cloud-managed services, and self-hosted clusters where monitoring requirements differ.
Evaluate the following factors:
- Database compatibility: Confirm support for each engine, version, cloud service, and deployment architecture.
- Query visibility: Check whether the platform captures normalized query metrics, samples, execution plans, wait events, and blocking information.
- Infrastructure correlation: Determine whether database behavior can be compared with CPU, memory, storage, network, application traces, and logs.
- Collection overhead: Understand agent requirements, permissions, polling frequency, query sampling, and potential performance impact.
- Alert quality: Look for actionable thresholds, anomaly detection, alert grouping, and integration with incident-management workflows.
- Historical analysis: Review retention periods, trend analysis, comparison tools, and the ability to investigate incidents after they occur.
- Multi-environment visibility: Assess how the tool handles on-premises, cloud, hybrid, and multi-region deployments.
- Access and governance: Check role-based access, sensitive query-data handling, auditability, and separation of operational responsibilities.
- Scalability: Test the platform with realistic database counts, query volumes, and telemetry rates.
- Total cost: Include licensing, data ingestion, retention, infrastructure, agents, support, and ongoing administration.
A proof of concept should reproduce a real performance issue. For example, introduce a slow query, a connection spike, or a lock contention scenario in a test environment. Check whether the monitoring tool identifies the symptom, provides enough context to investigate it, and delivers alerts to the right team.
Common Database Monitoring Mistakes
- Monitoring only CPU and memory: These metrics do not explain every query bottleneck, lock, or wait event.
- Alerting on every metric: Excessive alerts create noise and can hide the incidents that need attention.
- Ignoring query-level visibility: Instance-level dashboards may show a slowdown without identifying the statements responsible.
- Overlooking application context: Database performance is often affected by application behavior, connection pools, and deployment changes.
- Failing to monitor replication: Replica lag can create data freshness and availability problems even when the primary database appears healthy.
- Ignoring monitoring overhead: Collection methods and sampling settings should be tested under realistic workloads.
- Not reviewing historical trends: A single snapshot cannot explain gradual capacity pressure or recurring performance degradation.
- Leaving alerts without ownership: Every important alert should have an owner, a response process, and a defined escalation path.
Final Perspective: Turn Database Telemetry into Faster Decisions
Database monitoring tools are most valuable when they help teams connect a performance symptom to its underlying cause. Datadog and New Relic are worth considering when database visibility needs to connect with broader application observability. Percona PMM offers an open-source option for supported MySQL, PostgreSQL, and MongoDB environments. SolarWinds DPA provides dedicated cross-platform performance analysis, while Amazon CloudWatch Database Insights is relevant to supported Amazon RDS workloads.
The right choice depends on database coverage, query-level detail, deployment model, telemetry cost, and how effectively the platform supports incident investigation. A well-designed monitoring program tracks meaningful metrics, establishes useful alerts, preserves historical context, and gives database and application teams a shared view of performance. That turns monitoring from a dashboard exercise into an operational capability that helps protect availability and improve user experience.
