Upgrade & Secure Your Future with DevOps, SRE, DevSecOps, MLOps!
We spend hours scrolling social media and waste money on things we forget, but won’t spend 30 minutes a day earning certifications that can change our lives.
Master in DevOps, SRE, DevSecOps & MLOps by DevOps School!
Learn from Guru Rajesh Kumar and double your salary in just one year.
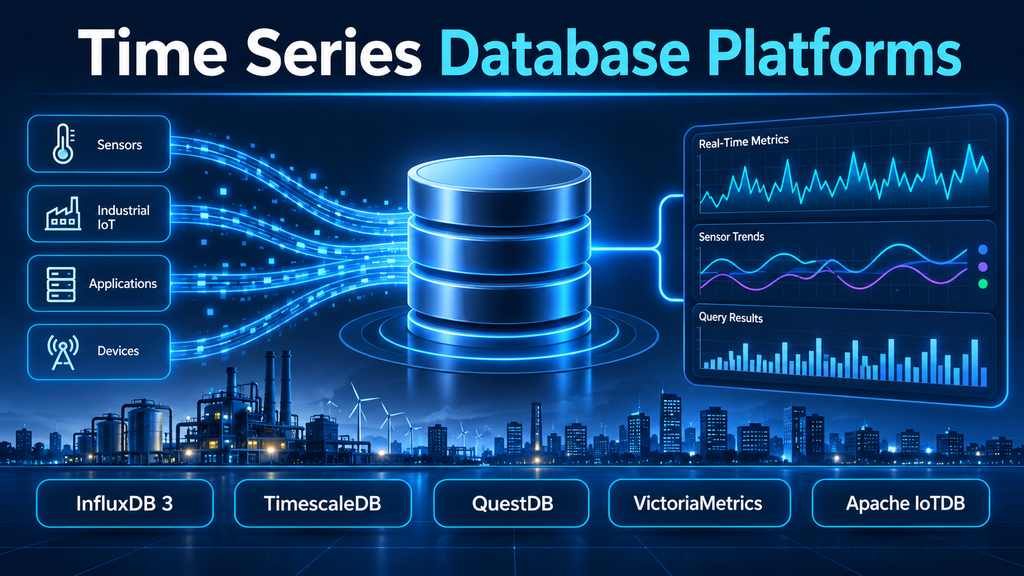
Time Series Database Platforms: Choosing the Right Engine for Continuous Data
Modern systems generate data continuously. Industrial sensors report temperatures, applications emit performance metrics, financial systems record transactions, and connected devices transmit measurements throughout the day. The challenge is not simply storing these records. It is capturing them efficiently, organizing them by time, and making recent and historical information useful without overwhelming storage or query infrastructure.
Time series database platforms are designed for this workload. They specialize in timestamped observations and provide capabilities such as high-throughput ingestion, time-based partitioning, retention policies, aggregation, compression, and time-window queries.
However, the category includes several different architectural approaches. Some platforms specialize in infrastructure monitoring, others target industrial telemetry or financial market data, while some extend familiar relational databases with time-series capabilities.
Choosing the right platform means understanding those differences before comparing features or prices.
What Makes a Time Series Database Different?
A time series is a sequence of observations associated with timestamps. A record might contain a timestamp, a measurement, and contextual information describing where the measurement originated.
For example:
| Timestamp | Device | Metric | Value |
|---|---|---|---|
| 10:00:00 | Sensor A | Temperature | 23.8 |
| 10:00:05 | Sensor A | Temperature | 24.1 |
| 10:00:10 | Sensor A | Temperature | 24.0 |
| 10:00:15 | Sensor A | Temperature | 24.4 |
A conventional relational database can store this information. The distinction is that a time series platform is designed around the characteristics of continuously arriving, timestamped records.
Its architecture may optimize for:
- High ingestion rates: Accepting frequent measurements from many sources.
- Time-based organization: Partitioning or indexing records according to their timestamps.
- Fast recent-data queries: Retrieving the latest measurements without scanning large historical datasets.
- Aggregation: Calculating averages, minimums, maximums, rates, and other summaries over time windows.
- Retention and lifecycle management: Controlling how long detailed measurements remain available.
- Compression: Reducing the storage footprint of repetitive or highly structured observations.
- Out-of-order data: Handling measurements that arrive later than their event timestamps.
These capabilities are especially valuable when the volume of records grows continuously and applications need both current visibility and historical analysis.
Five Platforms Worth Understanding
The following products represent different approaches to time-series storage. They should not be treated as interchangeable alternatives: their strengths depend heavily on the data being collected and the systems that consume it.
1. InfluxDB 3 — Purpose-Built Storage for Time-Indexed Workloads
InfluxDB is a widely recognized time-series database platform. Its third-generation architecture introduces a modern storage and query approach built around Apache Arrow, Apache DataFusion, and Parquet.
InfluxDB 3 supports SQL and InfluxQL, with line protocol available for writing time-series data. Its ecosystem also includes Telegraf for collecting information from a broad range of infrastructure and application sources.
The platform is available in different editions and deployment models, including open-source InfluxDB 3 Core and commercial Enterprise and cloud offerings. Their capabilities are not identical, so buyers should compare the specific edition rather than assuming every feature exists in every deployment.
Where it fits:
- IoT telemetry collection
- Infrastructure and application monitoring
- Sensor-driven applications
- Real-time dashboards
- Operational analytics
Important consideration: InfluxDB 3 Core has specific query-range limitations and is optimized for recent data. Organizations requiring extensive historical queries, high availability, or distributed deployments should evaluate the appropriate Enterprise or hosted offering.
Official documentation: InfluxDB 3 Documentation
2. TimescaleDB — Time Series Without Leaving PostgreSQL
TimescaleDB takes a different approach. Instead of introducing an entirely separate database model, it extends PostgreSQL with functionality designed for time-series workloads.
Its central concept is the hypertable. A hypertable behaves like a regular PostgreSQL table from the application’s perspective, while TimescaleDB automatically organizes its underlying data into smaller chunks based on time and, optionally, another partitioning dimension.
This allows development teams to use familiar SQL and PostgreSQL capabilities while managing large volumes of timestamped records.
Other relevant capabilities include continuous aggregates, data lifecycle policies, and columnar storage functionality.
Where it fits:
- Applications already built on PostgreSQL
- Business applications combining event data and relational records
- Operational analytics
- IoT applications requiring relational joins
- Products that benefit from PostgreSQL tools and drivers
Important consideration: TimescaleDB inherits PostgreSQL’s operational model. Database configuration, indexing, connection management, storage planning, and workload tuning remain important. It is also necessary to verify the available features and licensing terms for the chosen deployment.
Official documentation: Tiger Data / TimescaleDB Documentation
3. QuestDB — Low-Latency Analytics on Time-Ordered Data
QuestDB is designed around high-throughput ingestion and fast analytical queries over time-series datasets.
Its column-oriented, time-partitioned architecture is particularly relevant for workloads where applications need to ingest continuous streams and query large numbers of timestamped records.
QuestDB provides SQL with time-series extensions such as SAMPLE BY, LATEST ON, and time-aware joins. It also supports multiple ingestion and query interfaces, including PostgreSQL-compatible connectivity and REST APIs.
The platform’s architecture includes write-ahead logging, native columnar storage, and Parquet-based storage capabilities. Enterprise functionality adds capabilities beyond the open-source edition.
Where it fits:
- Financial market data
- Trading and transaction analytics
- Industrial telemetry
- High-volume event ingestion
- Applications requiring time-aware SQL queries
Important consideration: QuestDB’s specialized architecture and SQL extensions should be evaluated against existing application requirements. Teams should test their actual query patterns, ingestion behavior, late-arriving data, and operational needs rather than relying solely on published performance claims.
Official documentation: QuestDB Documentation
4. VictoriaMetrics — Efficient Storage for Monitoring Metrics
VictoriaMetrics is particularly relevant when the workload consists of monitoring metrics generated by servers, containers, applications, and infrastructure components.
It supports Prometheus-compatible ingestion and query workflows, as well as several other ingestion protocols. This makes it an option for organizations looking to manage monitoring data without depending exclusively on a conventional Prometheus deployment for long-term storage.
VictoriaMetrics provides both single-node and cluster deployment models.
The single-node edition is useful for deployments that can operate within one server’s capacity. The cluster edition is intended for workloads that require horizontal scaling and additional deployment flexibility.
Where it fits:
- Infrastructure monitoring
- Kubernetes and container metrics
- Prometheus-compatible environments
- Long-term metrics storage
- Large-scale observability systems
Important consideration: VictoriaMetrics is primarily a monitoring-metrics platform, not a general-purpose database for every kind of timestamped business event. Teams should evaluate label cardinality, retention requirements, tenant isolation, and query compatibility.
Official documentation: VictoriaMetrics Documentation
5. Apache IoTDB — Managing Industrial and Device-Centric Time Series
Apache IoTDB is an open-source time-series data management system with a strong focus on Internet of Things and industrial environments.
Industrial deployments often generate measurements from large numbers of devices, sensors, machines, and production systems. Organizing that information around device identities and measurement paths is a central part of the problem.
IoTDB is designed for time-series collection, storage, and analysis, with deployment approaches that can support both edge and larger-scale environments. Its ecosystem also includes TsFile, a columnar file format designed for time-series data.
Where it fits:
- Industrial IoT systems
- Manufacturing telemetry
- Device and sensor management
- Edge data collection
- Industrial monitoring and analytics
Important consideration: IoTDB is a more specialized choice than a general-purpose relational extension. Organizations should validate its ecosystem compatibility, data synchronization requirements, operational tooling, and integration with their existing industrial systems.
Official project: Apache IoTDB
Comparing the Platforms
| Platform | Primary orientation | Query approach | Particularly relevant for |
|---|---|---|---|
| InfluxDB 3 | Purpose-built time-series storage | SQL, InfluxQL | Telemetry and real-time applications |
| TimescaleDB | PostgreSQL extension | PostgreSQL SQL | Relational and time-series applications |
| QuestDB | High-performance time-series analytics | SQL with time-series extensions | Market data and high-volume event analysis |
| VictoriaMetrics | Monitoring metrics storage | Prometheus-compatible query ecosystem | Infrastructure observability |
| Apache IoTDB | Industrial and device-oriented time series | IoTDB query interfaces | Industrial IoT and sensor networks |
There is no universal winner. A team operating a Prometheus-based monitoring environment has different requirements from a financial data platform processing market events or a factory collecting measurements from thousands of machines.
How Time Series Databases Organize Data
Understanding the underlying data model helps explain why platform selection matters.
Timestamp and measurement
Every observation is associated with a timestamp. The measurement contains the value being recorded, such as CPU utilization, temperature, pressure, latency, or transaction volume.
Tags, labels, and dimensions
Metadata identifies the source or context of a measurement. Examples include:
- Device ID
- Region
- Application name
- Hostname
- Sensor type
- Environment
- Customer or tenant
The terminology varies across platforms. In some systems, metadata is represented through tags or labels; in others, it is stored as ordinary columns or structured device paths.
Time partitioning
A database may divide records into time-based chunks or partitions. This can help queries skip irrelevant historical data and make retention management more efficient.
The appropriate partition interval depends on ingestion volume, query patterns, index size, and available memory. A poorly chosen configuration can create too many small partitions or oversized chunks that are difficult to manage.
Aggregation and downsampling
Applications rarely need every raw measurement for every dashboard request.
A monitoring system might retain high-resolution CPU measurements for a short period, then maintain hourly or daily summaries for longer-term reporting.
This process is commonly called downsampling. It reduces the amount of data that must be queried for long-range trends, but the original high-resolution information may no longer be available after its retention period expires.
The Decisions That Matter More Than Feature Lists
A successful selection process begins with the workload rather than the product catalog.
1. Measure ingestion requirements
Estimate how many records arrive per second, how many sources produce them, and whether ingestion occurs continuously or in bursts.
Also account for:
- Peak traffic rather than average traffic
- Batch size
- Network interruptions
- Retry behavior
- Duplicate records
- Out-of-order timestamps
A platform that handles a controlled benchmark may behave differently when real devices reconnect and send delayed measurements.
2. Understand time-series cardinality
Cardinality describes the number of unique time series created by combinations of metric names and metadata values.
For example, adding a unique identifier to every measurement can create an enormous number of distinct series.
This can increase memory consumption, indexing overhead, and query complexity in systems that organize data around series identities.
Avoid uncontrolled labels such as request IDs, session IDs, or arbitrary user identifiers in monitoring metrics. Keep high-cardinality business attributes in an appropriate event or analytical data model when necessary.
3. Define query patterns
Consider what applications actually need to retrieve.
Common requirements include:
- Latest measurement for a device
- Average value over a five-minute interval
- Maximum temperature during a production shift
- Comparison between regions
- Detection of missing measurements
- Historical trends over several months
- Correlation between events and operational metrics
Test these queries using representative data volumes. Ingestion speed alone does not establish whether a platform is suitable for analytical workloads.
4. Decide how long data must be retained
Retention policies can have a substantial effect on infrastructure costs.
A practical retention design might include:
- High-resolution data for short-term troubleshooting
- Aggregated data for operational reporting
- Long-term historical data in compressed or object storage
The correct design depends on business requirements, audit obligations, analytical use cases, and recovery needs.
5. Evaluate deployment and availability
Determine whether the system must run on-premises, in a public cloud, at the edge, or across multiple environments.
Evaluate:
- High availability
- Replication
- Backup and restoration
- Horizontal scaling
- Disaster recovery
- Multi-tenancy
- Upgrade procedures
- Monitoring of the database itself
A single-node deployment may be appropriate for a small application but insufficient for a critical distributed monitoring service.
Common Implementation Mistakes
Treating every timestamped dataset as a monitoring metric
A financial transaction, an industrial sensor reading, and a CPU utilization measurement all contain timestamps. Their data models and query requirements can nevertheless be very different.
Choose a platform based on the workload, not simply because records contain dates and times.
Ignoring late-arriving measurements
Real systems experience network delays, disconnected devices, buffered events, and clock differences. A database must be evaluated for how it handles out-of-order records and corrections.
Using excessive metadata dimensions
Uncontrolled labels can create cardinality problems and make monitoring systems more expensive to operate.
Define naming conventions and metadata policies before deploying collectors across a large environment.
Keeping all data at maximum resolution
High-resolution data can be valuable for troubleshooting, but retaining every measurement indefinitely may be unnecessary.
Design retention and aggregation policies around actual operational and analytical requirements.
Overlooking migration compatibility
A move between database generations can affect query languages, APIs, data models, retention behavior, and client libraries.
For example, InfluxDB 3 does not support Flux, the query language introduced in InfluxDB 2. Organizations migrating from earlier versions should review the relevant migration documentation and test application compatibility before changing production systems.
Security, Governance, and Operational Control
Time-series platforms often collect sensitive operational information. Metrics can reveal application activity, infrastructure topology, production performance, and usage patterns.
Security planning should include:
- Authentication and authorization for database clients
- Encryption in transit and appropriate storage protection
- Network segmentation and restricted administrative access
- Secure management of API tokens and service credentials
- Tenant isolation where multiple customers or teams share infrastructure
- Backup protection and recovery testing
- Auditability of administrative actions
- Data retention and deletion policies
Also evaluate the security responsibilities of managed services versus self-hosted deployments. A managed platform can reduce infrastructure administration, but it does not remove the organization’s responsibility for identity management, access policies, data classification, and application security.
What Does a Time Series Database Cost?
Pricing depends on the deployment model and the amount of data the platform must process and retain.
Common cost drivers include:
Ingestion volume: Some hosted services charge according to write volume, data points, or related usage measures.
Storage consumption: Retaining high-resolution measurements for long periods can increase storage requirements.
Query workload: Frequent dashboard refreshes, long-range analytical queries, and concurrent users may affect compute costs.
High availability: Replicas, additional nodes, and disaster-recovery infrastructure add operational expense.
Data transfer: Moving measurements between cloud regions, storage tiers, and external analytics systems can create additional charges.
Administration: Self-hosted platforms may reduce software licensing costs but require engineering time for upgrades, monitoring, backups, capacity planning, and incident response.
A meaningful comparison should model total cost over the expected retention period rather than comparing only entry-level subscription prices.
Frequently Asked Questions
What is a time series database used for?
It stores and analyzes timestamped data generated continuously by applications, sensors, machines, infrastructure, financial systems, and connected devices.
Can PostgreSQL handle time-series data?
Yes. PostgreSQL can store timestamped records using standard tables and indexes. TimescaleDB extends PostgreSQL with hypertables and other time-series capabilities for workloads that need more specialized data management.
What is the difference between a time series database and a monitoring platform?
A time series database provides storage and query capabilities for timestamped observations. A monitoring platform typically combines data collection, storage, dashboards, alerting, and operational workflows. A time series database may be one component of a larger monitoring system.
Are time series databases suitable for IoT applications?
Yes. They are commonly used for sensor readings, device telemetry, industrial measurements, and connected equipment. The best choice depends on ingestion volume, device organization, edge requirements, and historical analysis needs.
Do time series databases replace data warehouses?
Not necessarily. Time series databases are optimized for continuous timestamped workloads and operational queries. Data warehouses are generally designed for broader analytical reporting across structured business datasets. Many organizations use both.
How should organizations choose between InfluxDB and TimescaleDB?
InfluxDB is a purpose-built time-series platform with its own ingestion and storage architecture. TimescaleDB extends PostgreSQL, making it attractive when relational data, standard SQL, and existing PostgreSQL applications are important. The decision should account for query patterns, deployment requirements, operational expertise, and migration needs.
The Right Platform Starts With the Shape of the Data
Time series database platforms solve a specific but increasingly important infrastructure problem: managing continuous streams of timestamped information without losing the ability to analyze what is happening now and what happened in the past.
InfluxDB 3, TimescaleDB, QuestDB, VictoriaMetrics, and Apache IoTDB illustrate how different architectures serve different needs. The strongest selection is not necessarily the platform with the longest feature list. It is the one that fits the data model, ingestion pattern, query workload, retention strategy, and operational capabilities of the organization.
Before committing to a platform, run a proof of concept using realistic data, representative queries, late-arriving events, and expected retention volumes. That exercise will reveal practical constraints that a feature comparison alone cannot.
