Upgrade & Secure Your Future with DevOps, SRE, DevSecOps, MLOps!
We spend hours scrolling social media and waste money on things we forget, but won’t spend 30 minutes a day earning certifications that can change our lives.
Master in DevOps, SRE, DevSecOps & MLOps by DevOps School!
Learn from Guru Rajesh Kumar and double your salary in just one year.
Introduction
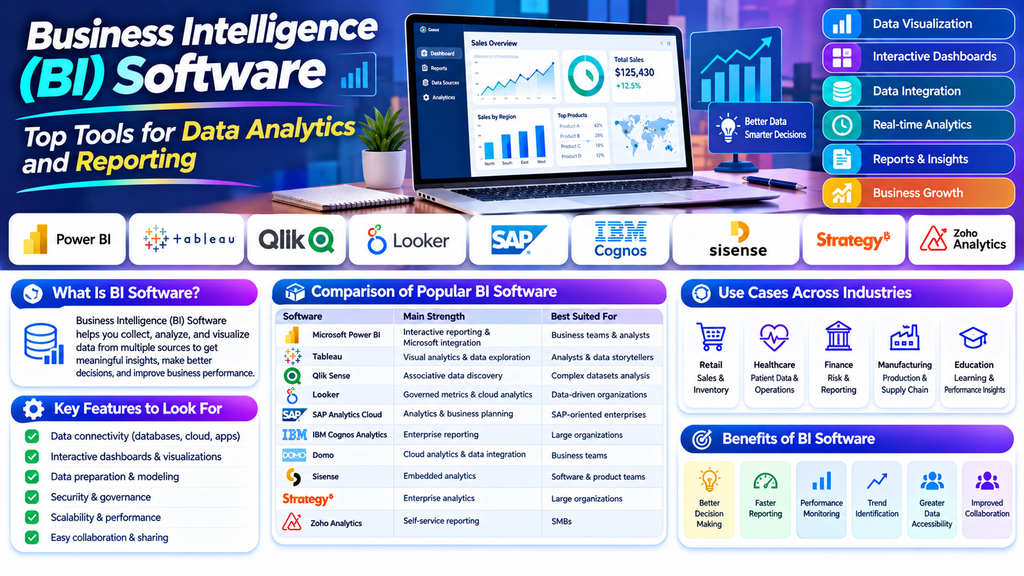
Business Intelligence (BI) Software helps organizations transform raw data into meaningful insights for better decision-making. These tools collect, analyze, visualize, and report business information from multiple sources, allowing teams to understand performance, identify trends, and monitor key metrics.
From sales dashboards and financial reports to customer analytics and operational performance, BI platforms help businesses make data-driven decisions. Whether you are a small business owner, data analyst, or enterprise manager, choosing the right BI software can improve reporting efficiency and business visibility.
What Is Business Intelligence (BI) Software?
Business Intelligence Software is a category of applications that helps users access, analyze, and present business data. It typically includes interactive dashboards, reporting tools, data visualization, data preparation, and connections to databases, spreadsheets, cloud services, and business applications.
BI platforms help users answer questions such as which products perform best, where costs are increasing, and how customer behavior changes over time.
Top Business Intelligence (BI) Software Tools
1. Microsoft Power BI
Microsoft Power BI is a widely used analytics platform for building interactive dashboards and business reports. It connects to a variety of data sources and integrates with other Microsoft products.
Key features:
- Interactive dashboards and visualizations
- Data preparation with Power Query
- Data modeling and DAX calculations
- Integration with Microsoft Excel and other business services
Best for: Organizations seeking accessible reporting and analytics across business departments.
2. Tableau
Tableau is a data visualization and analytics platform known for interactive charts, dashboards, and visual exploration. It enables users to investigate patterns in business data and communicate findings.
Key features:
- Interactive visual analytics
- Dashboard creation and sharing
- Connections to multiple data sources
- Data exploration and filtering
Best for: Analysts and teams that prioritize visual storytelling and exploratory analytics.
3. Qlik Sense
Qlik Sense provides analytics and dashboarding capabilities with an associative data exploration approach. It allows users to explore relationships between different data points and investigate business questions.
Key features:
- Interactive dashboards
- Associative data exploration
- Data integration and analytics
- Self-service reporting capabilities
Best for: Organizations that need flexible data exploration across multiple business datasets.
4. Looker
Looker is a business intelligence platform from Google Cloud that supports governed analytics and data exploration. It uses a modeling layer to help teams define consistent business metrics and access trusted data.
Key features:
- Centralized semantic modeling with LookML
- Interactive dashboards and reports
- Data exploration and governed metrics
- Integration with supported cloud data platforms
Best for: Data-driven organizations that need consistent metrics and cloud-based analytics.
5. SAP Analytics Cloud
SAP Analytics Cloud combines business intelligence, planning, and predictive analytics capabilities. It can help organizations analyze business performance and connect reporting with planning workflows.
Key features:
- Interactive reporting and dashboards
- Planning and forecasting capabilities
- Predictive analytics features
- Integration with supported SAP systems
Best for: Organizations that use SAP business applications and need connected analytics and planning.
6. IBM Cognos Analytics
IBM Cognos Analytics provides reporting, dashboarding, and data analysis tools for business users and enterprise teams.
Key features:
- Report authoring and distribution
- Interactive dashboards
- Data exploration and visualization
- Enterprise reporting capabilities
Best for: Organizations that require structured reporting and managed analytics workflows.
7. Domo
Domo is a cloud-based business intelligence platform that combines data integration, dashboards, and collaboration features.
Key features:
- Cloud-based analytics dashboards
- Data connectors and integration
- Automated reporting workflows
- Collaboration and sharing features
Best for: Teams seeking a centralized cloud analytics environment.
8. Sisense
Sisense provides analytics tools designed to help organizations analyze data and embed insights into applications, portals, and customer-facing products.
Key features:
- Interactive dashboards
- Embedded analytics
- Data modeling and integration
- Customizable analytics experiences
Best for: Software companies and businesses that want to integrate analytics into their products.
9. MicroStrategy
MicroStrategy, now known as Strategy, provides enterprise analytics and business intelligence capabilities for organizations that need governed reporting and large-scale data access.
Key features:
- Enterprise dashboards and reports
- Governed metrics and analytics
- Mobile analytics capabilities
- Enterprise data access and distribution
Best for: Large organizations requiring consistent analytics and enterprise reporting.
10. Zoho Analytics
Zoho Analytics is a self-service BI and data analytics platform that helps users build reports, dashboards, and data visualizations.
Key features:
- Drag-and-drop report creation
- Interactive dashboards
- Data blending and analysis
- Integration with supported business applications
Best for: Small and medium-sized businesses seeking approachable analytics and reporting.
Comparison of Popular BI Software
| Software | Main strength | Best suited for |
|---|---|---|
| Microsoft Power BI | Interactive reporting and Microsoft integration | Business teams and analysts |
| Tableau | Visual analytics and data exploration | Analysts and data storytellers |
| Qlik Sense | Associative data discovery | Teams analyzing complex datasets |
| Looker | Governed metrics and cloud analytics | Data-driven organizations |
| SAP Analytics Cloud | Analytics and business planning | SAP-oriented enterprises |
| IBM Cognos Analytics | Enterprise reporting | Large organizations |
| Domo | Cloud analytics and data integration | Business teams needing centralized insights |
| Sisense | Embedded analytics | Software and product teams |
| Strategy (formerly MicroStrategy) | Enterprise analytics | Large organizations |
| Zoho Analytics | Self-service reporting | Small and medium-sized businesses |
Key Features to Look for in BI Software
Data Connectivity
Choose a platform that connects to your existing databases, spreadsheets, cloud warehouses, CRM systems, and business applications.
Interactive Dashboards
Dashboards should help users explore key performance indicators, filter results, and understand trends without creating a new report for every question.
Data Preparation and Modeling
Reliable data cleaning, transformation, relationships, and metric definitions are essential for producing accurate business insights.
Visualization and Reporting
Look for suitable charts, tables, scheduled reports, and export options that communicate findings clearly.
Security and Governance
Role-based access, data permissions, auditability, and consistent metric definitions are important when handling business-sensitive information.
Scalability and Performance
Evaluate how the software performs as datasets, user counts, and reporting requirements grow.
Benefits of Business Intelligence Software
- Better decision-making: Use evidence and measurable business indicators to guide decisions.
- Faster reporting: Automate repetitive reports and reduce manual spreadsheet work.
- Improved performance monitoring: Track KPIs across teams, products, and departments.
- Trend identification: Discover patterns and potential problems in business data.
- Greater data accessibility: Make relevant information available to authorized users.
- Improved collaboration: Share consistent reports and dashboards across departments.
How to Choose the Right BI Software
- Define your objectives: Identify whether you need executive dashboards, financial reporting, sales analysis, or embedded analytics.
- Assess your data sources: Check whether the platform connects to your current systems and data warehouse.
- Understand user skills: Consider whether your team needs drag-and-drop reporting or advanced data modeling.
- Review governance requirements: Confirm access controls, data security, and metric consistency.
- Compare total costs: Evaluate licensing, deployment, training, administration, and scaling costs.
- Test a real use case: Build a sample dashboard using representative data before making a decision.
Common Mistakes to Avoid
- Selecting a BI platform before defining business questions
- Building dashboards without clear KPIs
- Using inconsistent data definitions across departments
- Ignoring data quality and refresh schedules
- Creating overly complicated visualizations
- Overlooking user training and dashboard adoption
- Failing to review permissions and data security
Conclusion
Business Intelligence (BI) Software helps businesses convert data into actionable insights through dashboards, reporting, and interactive analytics. Microsoft Power BI, Tableau, Qlik Sense, Looker, SAP Analytics Cloud, and Zoho Analytics are among the options that serve different reporting and analysis needs.
The best platform depends on your data sources, team skills, governance requirements, budget, and business goals. By choosing suitable BI software and maintaining reliable data practices, organizations can improve reporting efficiency, monitor performance, and make more informed decisions.
