Upgrade & Secure Your Future with DevOps, SRE, DevSecOps, MLOps!
We spend hours scrolling social media and waste money on things we forget, but won’t spend 30 minutes a day earning certifications that can change our lives.
Master in DevOps, SRE, DevSecOps & MLOps by DevOps School!
Learn from Guru Rajesh Kumar and double your salary in just one year.
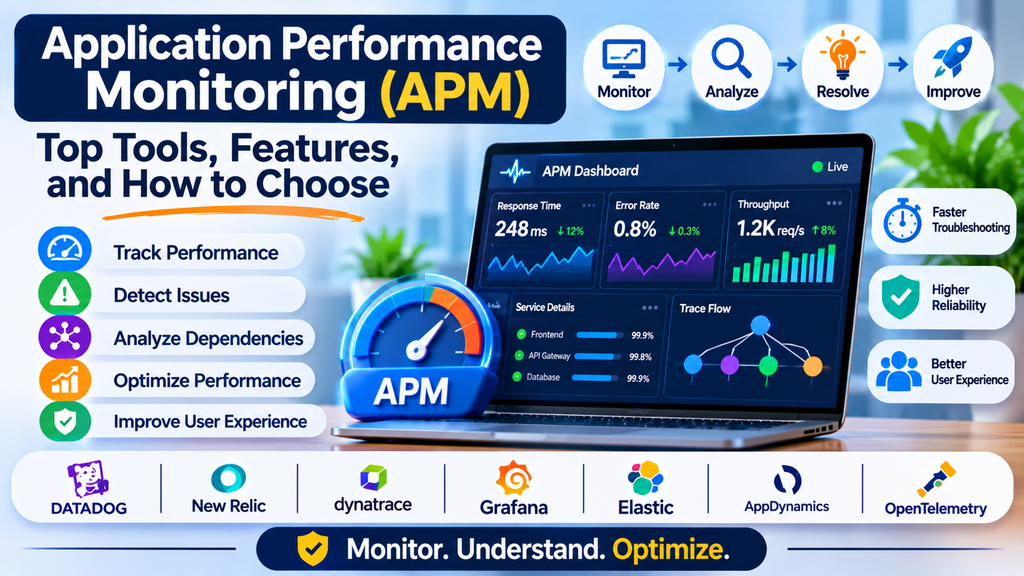
Applications are expected to respond quickly, remain available, and deliver a smooth user experience. Even a small performance issue can affect customer satisfaction, business operations, and revenue. As applications become more complex and depend on APIs, databases, cloud services, and microservices, identifying the cause of slowdowns becomes increasingly challenging.
Application Performance Monitoring (APM) helps development and operations teams measure application performance, detect errors, investigate bottlenecks, and improve reliability. It is an important capability in modern DevOps and site reliability engineering (SRE).
What Is Application Performance Monitoring (APM)?
Application Performance Monitoring is the process of collecting and analyzing data about an application’s speed, availability, errors, and resource usage. APM tools provide visibility into application behavior so teams can understand how software performs under real-world conditions.
An APM platform may track response times, request throughput, error rates, database queries, external service calls, and distributed transactions. Many platforms also offer dashboards, alerting, transaction tracing, and root-cause investigation features.
For example, if an online shopping website takes several seconds to load a product page, an APM tool can help engineers determine whether the delay originates in the application code, a database query, an external API, or an infrastructure resource.
Why Is APM Important?
APM helps organizations maintain application performance and deliver dependable digital services.
- Faster issue detection: Identify slow transactions, application errors, and performance degradation.
- Improved user experience: Find issues that cause pages to load slowly or transactions to fail.
- Reduced troubleshooting time: Use transaction-level data to investigate the source of problems.
- Better resource utilization: Identify inefficient code, slow queries, and resource bottlenecks.
- Increased application reliability: Detect recurring issues and monitor service health.
- Support for DevOps teams: Give developers and operations teams shared visibility into production behavior.
- Improved business outcomes: Help reduce the operational impact of poor performance and service interruptions.
How Does APM Work?
APM tools typically combine instrumentation, telemetry collection, analysis, and alerting.
1. Application Instrumentation
Instrumentation collects performance data from application code and runtime environments. It can be implemented through language agents, libraries, automatic instrumentation, or manual code changes.
2. Data Collection
The platform collects information such as request duration, transaction volume, exceptions, database activity, and external service calls.
3. Performance Analysis
Collected data is analyzed to identify slow transactions, unusual error rates, latency patterns, and potential bottlenecks.
4. Visualization and Dashboards
Dashboards display application health, response times, throughput, errors, and service dependencies so teams can understand performance trends.
5. Alerting
Teams configure alerts for meaningful conditions, such as a sustained increase in latency, a spike in failed requests, or a decline in availability.
6. Root-Cause Investigation
Engineers use traces, transaction details, logs, and related telemetry to narrow down the cause of an incident and determine the appropriate fix.
Key APM Metrics to Monitor
Understanding core performance metrics helps teams establish baselines and detect problems.
| Metric | What It Measures | Why It Matters |
|---|---|---|
| Response time | Time taken to process a request | Reveals slow application behavior |
| Throughput | Requests or transactions handled over time | Shows workload and capacity demand |
| Error rate | Percentage or number of failed requests | Identifies reliability problems |
| Latency percentiles | Response-time distribution, such as p95 and p99 | Reveals slow experiences affecting a subset of users |
| Apdex | A standardized application performance satisfaction score | Provides a simplified view of user-perceived performance |
| Database query time | Time spent executing database operations | Helps identify database bottlenecks |
| CPU and memory usage | Resources consumed by the application | Helps diagnose resource constraints |
| Availability | Whether a service is accessible and functioning | Supports reliability monitoring |
Teams should evaluate metrics together. For example, rising latency combined with increased database query time may indicate a database bottleneck, while a high error rate after a deployment may point toward a software regression.
Popular APM Tools
1. Datadog APM
Datadog APM provides distributed tracing, service maps, performance analysis, and integration with infrastructure monitoring and logs.
Best suited for: Teams seeking connected visibility across cloud infrastructure and distributed applications.
2. Dynatrace
Dynatrace provides application and infrastructure observability, automated dependency discovery, distributed tracing, and AI-assisted problem analysis.
Best suited for: Enterprises operating complex applications and large distributed environments.
3. New Relic
New Relic offers application monitoring, distributed tracing, transaction analysis, error tracking, and telemetry visualization.
Best suited for: Development teams that want to investigate application performance through a unified monitoring platform.
4. AppDynamics
AppDynamics focuses on application performance, transaction monitoring, business transaction visibility, and application dependency analysis.
Best suited for: Organizations that need visibility into business-critical application transactions.
5. Elastic APM
Elastic APM works within the Elastic ecosystem and supports application performance data, distributed traces, transaction details, and error analysis.
Best suited for: Teams already using Elastic tools for searching and analyzing operational data.
6. Grafana Cloud
Grafana Cloud provides managed observability capabilities, including support for metrics, traces, logs, and application monitoring workflows.
Best suited for: Teams that value flexible dashboards and integrations with open observability technologies.
7. OpenTelemetry
OpenTelemetry provides vendor-neutral instrumentation and collection standards for telemetry such as traces, metrics, and logs. It can send application data to compatible APM and observability backends.
Best suited for: Teams that want to standardize instrumentation and avoid depending entirely on one vendor’s instrumentation approach.
OpenTelemetry is not a complete APM user interface or storage backend on its own; it is commonly used alongside an appropriate observability platform.
APM Tool Comparison
| Tool | Key Strength | Common Use Case |
|---|---|---|
| Datadog APM | Distributed tracing and integrated monitoring | Cloud-native applications |
| Dynatrace | Automated discovery and AI-assisted analysis | Enterprise environments |
| New Relic | Transaction and error analysis | Application troubleshooting |
| AppDynamics | Business transaction monitoring | Business-critical applications |
| Elastic APM | Integration with Elastic search and analytics | Log and trace analysis |
| Grafana Cloud | Flexible dashboards and observability integrations | Cloud-native and open-source stacks |
| OpenTelemetry | Vendor-neutral instrumentation | Standardized telemetry collection |
Features, integrations, deployment choices, and pricing depend on the product edition and may change. Teams should validate current capabilities against their technical and operational requirements.
Essential Features of an APM Platform
When selecting an APM solution, evaluate the following features:
- End-to-end transaction tracing: Follow requests across application components and services.
- Code-level visibility: Investigate slow functions, exceptions, and inefficient execution paths where supported.
- Error tracking: Group and analyze application errors to identify recurring problems.
- Database monitoring: Understand query performance and database-related delays.
- Service maps: Visualize dependencies among applications and services.
- Real-time alerting: Notify the appropriate team when performance deteriorates.
- Infrastructure integration: Correlate application behavior with CPU, memory, containers, and host metrics.
- Language and framework support: Confirm compatibility with the technologies used by your applications.
- Scalability: Ensure the platform can handle increasing transaction volumes.
- Security and access controls: Protect telemetry and restrict access to sensitive information.
How to Choose the Right APM Tool
Step 1: Identify Your Monitoring Goals
Decide whether your priority is troubleshooting slow requests, monitoring errors, analyzing database performance, or tracing transactions across microservices.
Step 2: Check Technology Compatibility
Verify that the platform supports your programming languages, frameworks, databases, cloud environments, and deployment architecture.
Step 3: Evaluate Trace Quality
Test how effectively the tool follows a request across services and exposes the operations responsible for delays.
Step 4: Compare Costs
Review licensing, data ingestion, retention, host-based pricing, user limits, and any additional charges. High transaction volumes may significantly influence costs.
Step 5: Run a Practical Trial
Use a representative application to test latency analysis, error detection, alerting, and troubleshooting workflows. Evaluate whether engineers can identify a known problem efficiently.
Step 6: Consider Integration and Usability
Look for integrations with existing dashboards, incident management systems, logs, deployment pipelines, and team communication tools.
Step 7: Review Security Requirements
Assess access controls, data retention, sensitive-data masking, and compliance requirements before enabling production instrumentation.
APM Best Practices
- Establish performance baselines: Understand normal response times, throughput, and error rates before setting alerts.
- Prioritize critical transactions: Monitor login, checkout, payments, and other business-critical workflows.
- Use latency percentiles: Track p95 and p99 latency instead of relying only on averages.
- Correlate telemetry: Connect traces with logs, metrics, infrastructure data, and deployment events.
- Configure actionable alerts: Focus on sustained performance degradation and user impact.
- Monitor after deployments: Compare application performance before and after software releases.
- Manage instrumentation overhead: Test the impact of agents, sampling, and data collection on application resources.
- Protect sensitive information: Avoid collecting passwords, authentication tokens, payment details, and unnecessary personal data.
- Review recurring incidents: Use performance data to prioritize long-term improvements rather than repeatedly fixing symptoms.
- Define service-level objectives: Set measurable reliability and performance targets aligned with user expectations.
Common APM Challenges
APM implementations can face several challenges. High telemetry volumes may increase costs, while excessive instrumentation can add overhead. In distributed applications, missing trace context or inconsistent service naming can make troubleshooting harder.
Another common issue is alert fatigue caused by overly sensitive thresholds. Teams may also struggle to interpret large amounts of performance data without clear service-level objectives.
These challenges can be reduced by starting with critical services, applying appropriate sampling and retention policies, standardizing instrumentation, and regularly reviewing alerts and dashboards.
Conclusion
Application Performance Monitoring helps teams understand how applications behave in production, identify performance bottlenecks, and resolve errors before they significantly affect users. Platforms such as Datadog APM, Dynatrace, New Relic, AppDynamics, Elastic APM, and Grafana Cloud offer different approaches to application visibility, while OpenTelemetry supports standardized, vendor-neutral instrumentation.
The right APM solution should match your technology stack, provide useful transaction-level insights, integrate with existing workflows, and remain cost-effective as your applications scale. Combined with clear performance objectives and consistent monitoring practices, APM can improve application reliability, troubleshooting efficiency, and user experience.
