Upgrade & Secure Your Future with DevOps, SRE, DevSecOps, MLOps!
We spend hours scrolling social media and waste money on things we forget, but won’t spend 30 minutes a day earning certifications that can change our lives.
Master in DevOps, SRE, DevSecOps & MLOps by DevOps School!
Learn from Guru Rajesh Kumar and double your salary in just one year.
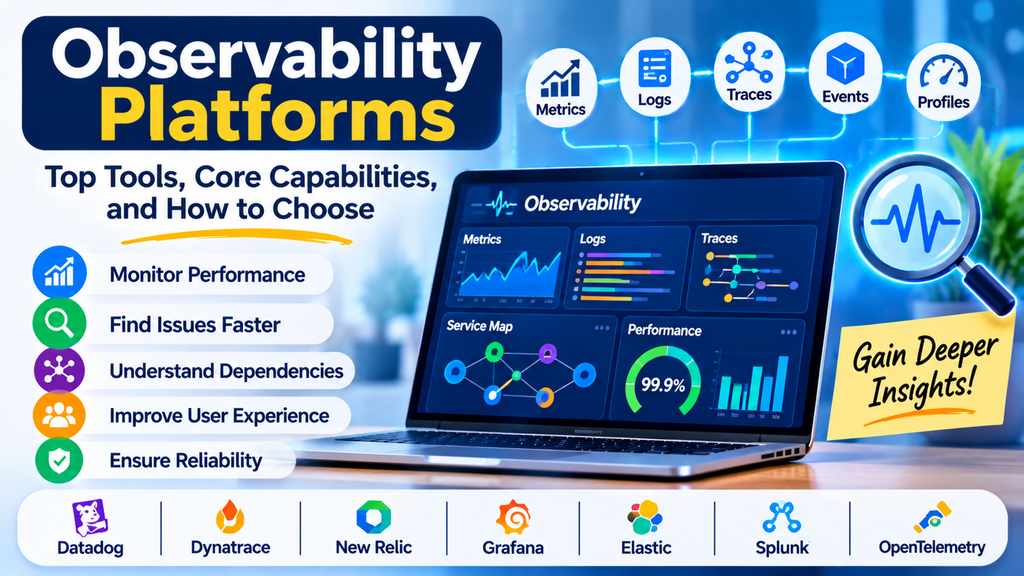
Modern applications run across cloud environments, containers, microservices, databases, APIs, and distributed infrastructure. When a performance issue occurs, identifying the root cause can be difficult because a problem in one component may affect several connected services. Observability platforms help engineering teams understand system behavior, detect unusual activity, and troubleshoot issues using data collected from across their technology stack.
For DevOps engineers, developers, and site reliability engineers (SREs), observability is an important part of maintaining application performance, availability, and reliability.
What Are Observability Platforms?
Observability platforms are software solutions that collect, analyze, correlate, and visualize operational data from applications and infrastructure. They help teams understand what is happening inside a system by examining telemetry data, including metrics, logs, traces, and, in some environments, profiles and events.
Unlike monitoring that focuses on predefined indicators and known failure conditions, observability helps teams investigate unfamiliar problems by exploring relationships between different signals.
For example, if an e-commerce website becomes slow, an observability platform can help engineers identify whether the issue is related to high CPU usage, a database query, an external API, or a particular microservice.
Why Are Observability Platforms Important?
Observability provides a broader view of application and infrastructure health. Its main benefits include:
- Faster troubleshooting: Correlate telemetry from multiple services to investigate issues more efficiently.
- Improved application performance: Identify bottlenecks, latency spikes, and resource utilization problems.
- Reduced downtime: Detect unusual behavior and alert teams before problems become widespread.
- Better user experience: Investigate errors and slow transactions that affect customers.
- Cloud-native visibility: Understand dependencies across containers, Kubernetes clusters, and distributed applications.
- Operational efficiency: Reduce the time spent switching between disconnected monitoring tools.
Key Components of Observability
1. Metrics
Metrics are numerical measurements collected over time. Examples include CPU utilization, memory usage, request rates, error rates, and response times. They help teams identify trends and evaluate system health.
2. Logs
Logs record events generated by applications, operating systems, databases, and infrastructure components. They provide detailed information that helps engineers investigate errors and understand what happened during a specific incident.
3. Distributed Traces
Traces follow a request as it travels through multiple services. They help identify slow operations, service dependencies, and bottlenecks in distributed applications.
4. Dashboards and Visualization
Dashboards present operational data through graphs, charts, service maps, and other visual elements. They help engineers recognize patterns and assess the health of applications.
5. Alerting and Anomaly Detection
Alerting features notify teams when defined thresholds or unusual patterns indicate a potential issue. Some platforms also use analytics or machine learning to identify anomalies that traditional threshold-based alerts might miss.
6. Correlation and Root Cause Investigation
Correlation connects related telemetry signals. For example, an increase in error rates can be examined alongside deployment events, application logs, and distributed traces to help identify the underlying cause.
Popular Observability Platforms
1. Datadog
Datadog provides a cloud-based observability platform with capabilities for infrastructure monitoring, application performance monitoring, logs, distributed tracing, dashboards, and alerting.
Best suited for: Organizations that want integrated visibility across cloud infrastructure, applications, and services.
2. Dynatrace
Dynatrace offers application and infrastructure observability, distributed tracing, automated dependency discovery, and AI-assisted analysis. Its capabilities can help teams investigate complex enterprise environments.
Best suited for: Enterprises managing large, complex, and distributed application environments.
3. New Relic
New Relic provides application performance monitoring, infrastructure monitoring, log management, distributed tracing, and telemetry analysis.
Best suited for: Development and operations teams seeking a unified platform for investigating application performance and reliability.
4. Grafana
Grafana is widely used for dashboards and visualization. It can connect to data sources such as Prometheus, Loki, and Tempo to support metrics, logs, and traces in an observability workflow.
Best suited for: Teams that want flexible dashboards and control over their observability architecture.
5. Elastic Observability
Elastic Observability combines logs, metrics, traces, and search capabilities within the Elastic ecosystem. It supports troubleshooting and analysis across applications and infrastructure.
Best suited for: Teams that need powerful search and analytics across large volumes of operational data.
6. Splunk Observability Cloud
Splunk Observability Cloud provides capabilities for infrastructure monitoring, application performance monitoring, and distributed tracing. It helps teams analyze service health and investigate performance problems.
Best suited for: Organizations that need observability across distributed services and complex operational environments.
7. OpenTelemetry
OpenTelemetry is an open-source framework and ecosystem for generating, collecting, and exporting telemetry data. It supports vendor-neutral instrumentation and helps teams send telemetry to compatible observability backends.
Best suited for: Engineering teams seeking standardized instrumentation and flexibility when selecting telemetry storage and analysis platforms.
OpenTelemetry is not, by itself, a complete observability backend. Teams generally use it with a compatible platform or backend for storage, querying, visualization, and alerting.
Observability Platform Comparison
| Platform | Main strengths | Common use case |
|---|---|---|
| Datadog | Integrated infrastructure and application monitoring | Cloud-native environments |
| Dynatrace | Automated discovery and AI-assisted analysis | Large enterprise systems |
| New Relic | Application monitoring and telemetry analysis | Application performance troubleshooting |
| Grafana | Flexible dashboards and data-source integration | Custom observability stacks |
| Elastic Observability | Search and analytics across telemetry | Log-heavy environments |
| Splunk Observability Cloud | Distributed application visibility | Complex service environments |
| OpenTelemetry | Vendor-neutral instrumentation and data collection | Standardizing telemetry pipelines |
The most appropriate option depends on the team’s architecture, required integrations, data volume, budget, and operational skills. Capabilities and pricing can vary by product edition and change over time.
Essential Features to Look For
When evaluating an observability platform, consider these capabilities:
- Unified telemetry: Support for metrics, logs, and traces in a connected workflow.
- Service dependency maps: Visibility into relationships between applications and infrastructure.
- Real-time analysis: Timely access to telemetry during performance issues.
- Powerful search and queries: Ability to filter and investigate large volumes of data.
- Alerting and incident integrations: Notifications through the team’s existing operational workflows.
- Cloud-native integrations: Compatibility with Kubernetes, containers, cloud providers, databases, and APIs.
- Open standards: Support for OpenTelemetry and other suitable instrumentation approaches.
- Access controls: Role-based access and security features appropriate to the organization.
- Cost management: Visibility into telemetry ingestion, retention, and usage-based charges.
How to Choose the Right Observability Platform
Step 1: Identify Your Requirements
Determine whether your main priority is infrastructure health, application performance, log analysis, distributed tracing, or a combination of these areas.
Step 2: Map Your Technology Stack
List your cloud providers, programming languages, databases, containers, orchestration tools, and existing monitoring systems. Confirm that candidate platforms support your environment.
Step 3: Evaluate Telemetry Correlation
Check whether engineers can move easily from an alert to a relevant dashboard, log entry, trace, or deployment event. Connected workflows can make investigations more efficient.
Step 4: Compare Total Cost
Evaluate licensing, data ingestion, retention, user access, and additional feature costs. High telemetry volume can significantly influence operating expenses.
Step 5: Test With a Real Use Case
Run a proof of concept using a representative application. Simulate an error, a latency increase, or a resource bottleneck and assess how quickly the platform helps the team investigate it.
Step 6: Review Security and Governance
Evaluate data handling, access permissions, retention controls, compliance needs, and deployment options before adopting a platform.
Observability Best Practices
- Instrument critical services first: Begin with business-critical applications and expand gradually.
- Use consistent naming: Standardize service names, environment labels, and other telemetry attributes.
- Connect related signals: Link metrics, logs, and traces wherever practical.
- Create actionable alerts: Alert on meaningful symptoms and user impact rather than every minor change.
- Control telemetry costs: Review sampling, retention, collection levels, and unused data.
- Establish service-level objectives: Define reliability targets and track indicators that reflect user experience.
- Protect sensitive data: Avoid collecting credentials, personal information, or other confidential values unnecessarily.
- Review incidents regularly: Use incident findings to improve instrumentation, dashboards, and alert rules.
Common Challenges
Observability platforms can introduce challenges when telemetry is spread across disconnected tools, instrumentation is inconsistent, or teams collect excessive data without a clear purpose. Large telemetry volumes can increase storage and processing costs. Poorly designed alerts may also create alert fatigue.
Teams can address these problems by defining clear objectives, standardizing instrumentation, applying appropriate sampling and retention policies, and regularly reviewing the usefulness of dashboards and alerts.
Conclusion
Observability platforms help engineering teams understand complex applications through metrics, logs, traces, and correlated operational data. Solutions such as Datadog, Dynatrace, New Relic, Grafana, Elastic Observability, and Splunk Observability Cloud offer different approaches to application and infrastructure visibility, while OpenTelemetry provides a vendor-neutral foundation for collecting telemetry.
The best choice is the platform that fits your architecture, makes troubleshooting practical, supports your reliability goals, and provides sustainable cost and data governance. With thoughtful implementation, observability can help teams detect problems earlier, investigate incidents faster, and deliver more reliable digital services.
