Upgrade & Secure Your Future with DevOps, SRE, DevSecOps, MLOps!
We spend hours scrolling social media and waste money on things we forget, but won’t spend 30 minutes a day earning certifications that can change our lives.
Master in DevOps, SRE, DevSecOps & MLOps by DevOps School!
Learn from Guru Rajesh Kumar and double your salary in just one year.
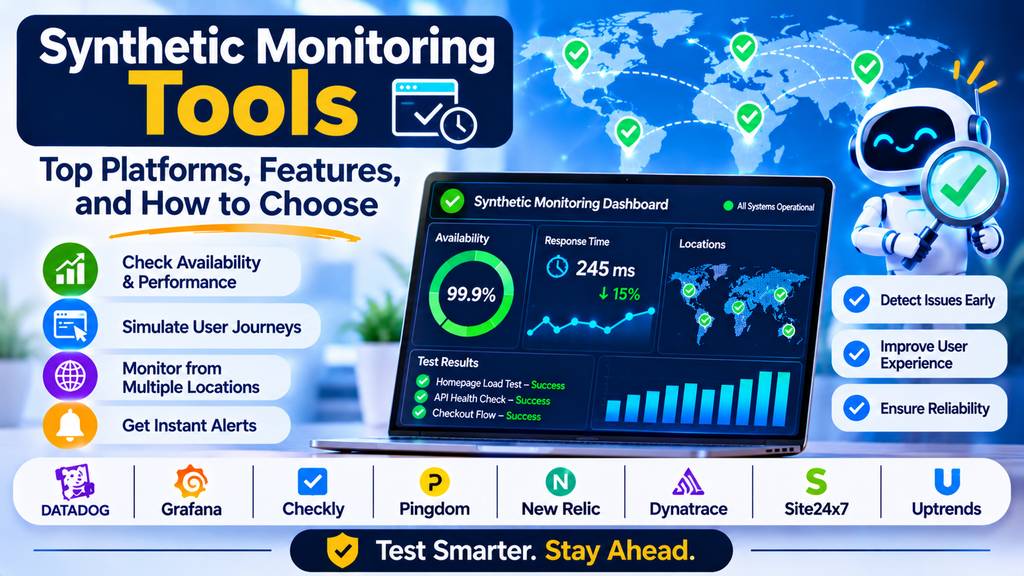
Websites and applications need to remain accessible, responsive, and reliable around the clock. However, problems can occur even when no users are actively reporting them. A failed login page, a slow API, an expired certificate, or an unavailable service can disrupt the user experience and affect business operations.
Synthetic monitoring helps teams detect these issues by running automated tests that simulate user actions or send scheduled requests to applications. It is widely used in DevOps, cloud operations, website reliability, and site reliability engineering (SRE).
What Are Synthetic Monitoring Tools?
Synthetic monitoring tools proactively test websites, APIs, and applications using scripted interactions or automated requests. These tests run from configured locations, devices, browsers, or monitoring agents and report whether a service is available and performing as expected.
Unlike Real User Monitoring (RUM), which measures actual user sessions, synthetic monitoring uses controlled tests. This makes it useful for checking critical workflows even when website traffic is low.
For example, an online shopping company can schedule a test that opens its website, searches for a product, adds it to a cart, and verifies that the checkout page loads successfully.
Why Is Synthetic Monitoring Important?
Synthetic monitoring allows organizations to discover service problems before customers report them.
- Early issue detection: Identify outages and failures through scheduled checks.
- Availability monitoring: Verify that websites and APIs respond successfully.
- Performance tracking: Measure response times under repeatable test conditions.
- Critical workflow validation: Test login, registration, search, and checkout journeys.
- Geographic visibility: Check availability and latency from different monitoring locations.
- Release validation: Detect regressions after application changes.
- Service-level tracking: Collect evidence to help evaluate availability and performance objectives.
How Does Synthetic Monitoring Work?
1. Define a Monitoring Test
Teams select a URL, API endpoint, or user workflow to monitor. Tests can range from a simple availability check to a complete browser-based transaction.
2. Configure Test Conditions
The test is configured with an execution frequency, timeout, expected results, and, where supported, browser, device, or geographic settings.
3. Execute Automated Checks
The monitoring system runs the test on a schedule. It may send an HTTP request, inspect a page, execute browser actions, or validate an API response.
4. Validate Results
The tool checks whether the expected status code, page element, response content, or workflow outcome is present.
5. Measure Performance
It records metrics such as response time, page-load duration, availability, and failures. Browser-based tests may also capture screenshots or diagnostic details.
6. Send Alerts and Reports
If a test fails or performance crosses a configured threshold, the platform can notify the responsible team through supported alerting integrations.
Types of Synthetic Monitoring
1. Uptime Monitoring
Uptime monitoring periodically checks whether a website or service is reachable. It is useful for detecting outages and unexpected response codes.
2. API Monitoring
API monitoring validates endpoints, response times, status codes, response bodies, and, where configured, authentication or request sequences.
3. Browser-Based Transaction Monitoring
Browser tests simulate user journeys such as logging in, searching, completing a form, or placing an order. They can reveal failures that simple uptime checks miss.
4. Network and Infrastructure Monitoring
Some synthetic monitoring solutions test network paths, DNS resolution, connection establishment, and other dependencies that affect application availability.
5. Geographic Monitoring
Tests run from multiple locations help identify regional differences in availability, latency, and content delivery.
6. Scheduled Performance Checks
Repeated tests help teams compare performance over time and identify changes after deployments or infrastructure updates.
Popular Synthetic Monitoring Tools
1. Datadog Synthetic Monitoring
Datadog provides synthetic tests for websites, APIs, and browser-based user journeys, with integration into its broader observability platform.
Best suited for: Teams that want synthetic testing connected to application performance and infrastructure monitoring.
2. Grafana Cloud Synthetic Monitoring
Grafana Cloud offers synthetic monitoring capabilities for checking endpoints and service availability, with results that can be explored alongside related observability data.
Best suited for: Teams using Grafana and related monitoring technologies.
3. Checkly
Checkly supports browser and API monitoring using programmable checks and browser automation. It is useful for validating both individual endpoints and complete user workflows.
Best suited for: Developer-focused teams that want monitoring tests integrated with code and deployment workflows.
4. Pingdom
Pingdom provides website uptime and performance monitoring capabilities. It can help teams identify availability problems and track website response times.
Best suited for: Website owners and operations teams that need straightforward uptime and performance checks.
5. New Relic Synthetics
New Relic Synthetics supports automated monitoring for websites and APIs, with integration into New Relic’s broader observability capabilities.
Best suited for: Teams that want scheduled synthetic checks alongside application performance data.
6. Dynatrace Synthetic Monitoring
Dynatrace provides synthetic monitoring for supported web and application environments, helping teams evaluate availability and performance from configured locations.
Best suited for: Enterprises monitoring complex applications and distributed services.
7. Site24x7
Site24x7 provides website, web application, and related availability monitoring capabilities. Available test types depend on the selected product and configuration.
Best suited for: Organizations looking for a broad monitoring platform for websites and IT infrastructure.
8. Uptrends
Uptrends offers website uptime monitoring, performance checks, and browser-based monitoring capabilities for supported use cases.
Best suited for: Teams that need website availability checks and visibility into user-facing service performance.
Synthetic Monitoring Tool Comparison
| Tool | Key Strength | Common Use Case |
|---|---|---|
| Datadog | Synthetic tests integrated with observability | Cloud applications |
| Grafana Cloud | Monitoring with Grafana ecosystem integration | Cloud-native services |
| Checkly | Programmable browser and API checks | Developer workflows |
| Pingdom | Website uptime and performance checks | Business websites |
| New Relic | Synthetic checks with application telemetry | Application reliability |
| Dynatrace | Enterprise synthetic monitoring | Complex distributed environments |
| Site24x7 | Website and infrastructure monitoring | IT operations |
| Uptrends | Website availability and performance monitoring | Public-facing websites |
Capabilities, supported locations, test frequencies, and pricing vary by product and subscription. Verify current features before choosing a platform.
Essential Features to Look For
When evaluating synthetic monitoring tools, consider these features:
- Uptime checks: Verify that websites and endpoints are reachable.
- API testing: Validate responses, status codes, and expected content.
- Browser automation: Simulate important user journeys.
- Multiple test locations: Detect regional availability and latency problems.
- Flexible scheduling: Run tests frequently enough for your reliability requirements.
- Custom assertions: Confirm that a page or transaction behaves as expected.
- Alerting integrations: Notify the right team when checks fail.
- Diagnostic evidence: Capture screenshots, logs, timings, or other supported details.
- Performance history: Compare results across releases and time periods.
- Secure credential handling: Protect test accounts, tokens, and other sensitive values.
How to Choose the Right Synthetic Monitoring Tool
Step 1: Identify Critical Services
List the websites, APIs, and user journeys that are essential to your business. Start with the services where failures would have the greatest impact.
Step 2: Choose the Right Test Type
Use simple uptime checks for availability, API tests for service contracts, and browser tests for workflows involving multiple user interactions.
Step 3: Evaluate Monitoring Locations
Select test locations that reflect your users, infrastructure, and important network paths.
Step 4: Define Success Criteria
Specify acceptable response times, expected content, valid status codes, and required workflow outcomes.
Step 5: Compare Alerting and Diagnostics
Confirm that failures provide enough evidence to support troubleshooting and that notifications can reach the appropriate team.
Step 6: Assess Cost and Maintenance
Consider the number of tests, execution frequency, browser-test duration, data retention, and effort required to maintain scripts as the application changes.
Step 7: Run a Pilot
Monitor a representative website or API, introduce a controlled test failure in a safe environment, and evaluate how clearly the tool detects and reports the problem.
Synthetic Monitoring Best Practices
- Prioritize important workflows: Test login, search, payments, and other critical transactions.
- Set realistic thresholds: Use performance targets based on service requirements and historical behavior.
- Choose appropriate test intervals: Balance early detection with execution cost and service load.
- Use independent monitoring locations: Multiple locations can help distinguish local network problems from broader outages.
- Avoid unnecessary test traffic: Ensure tests do not create unwanted transactions, consume real inventory, or trigger actual payments.
- Manage test credentials securely: Store secrets using supported secure mechanisms and rotate credentials appropriately.
- Review false positives: Tune timeouts, retries, and validation rules without masking genuine failures.
- Monitor test health: Verify that the monitoring scripts themselves are running successfully.
- Validate releases: Run relevant checks after deployments and configuration changes.
- Combine synthetic tests with RUM: Use synthetic checks for controlled validation and RUM for actual user experiences.
Common Synthetic Monitoring Challenges
Synthetic tests may fail because of application issues, network interruptions, expired credentials, changed page elements, or problems in the test environment. Browser scripts can become fragile when website layouts change frequently.
Another limitation is that synthetic tests cannot represent every combination of real user devices, browsers, networks, and behaviors. A successful test also does not guarantee that every part of an application is working correctly.
Teams can reduce these limitations by maintaining test scripts, using reliable validation rules, monitoring from suitable locations, and correlating synthetic results with real-user and backend telemetry.
Conclusion
Synthetic monitoring tools help organizations proactively validate website availability, API behavior, and critical user journeys. Platforms such as Datadog, Grafana Cloud, Checkly, Pingdom, New Relic, Dynatrace, Site24x7, and Uptrends offer different approaches to automated service testing.
The right tool should match your critical workflows, testing requirements, monitoring locations, alerting needs, and budget. When combined with Real User Monitoring and backend observability, synthetic monitoring helps teams detect failures earlier and deliver more dependable digital services.
