Upgrade & Secure Your Future with DevOps, SRE, DevSecOps, MLOps!
We spend hours scrolling social media and waste money on things we forget, but won’t spend 30 minutes a day earning certifications that can change our lives.
Master in DevOps, SRE, DevSecOps & MLOps by DevOps School!
Learn from Guru Rajesh Kumar and double your salary in just one year.
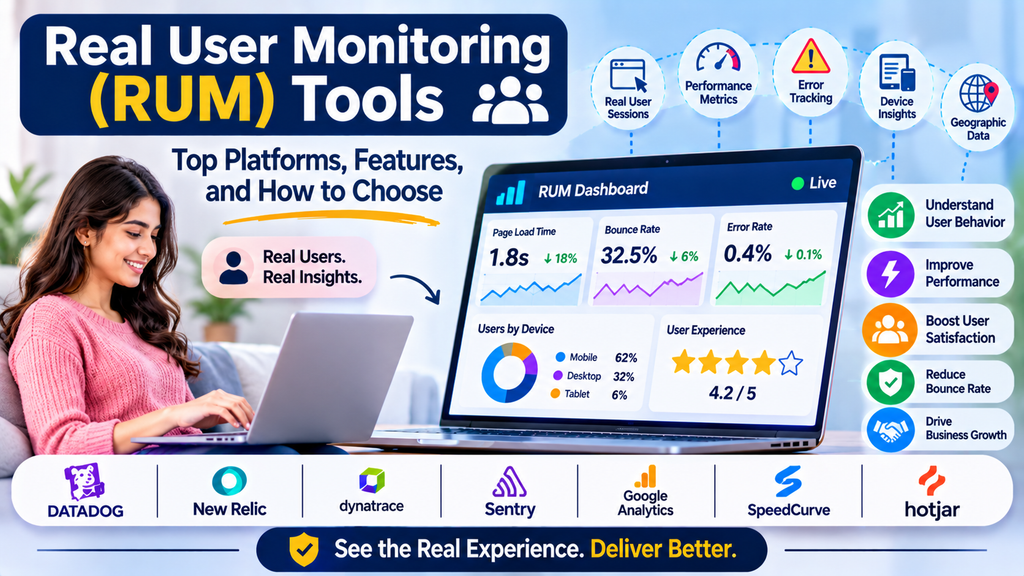
Real User Monitoring (RUM) Tools: Top Platforms, Features, and How to Choose
A website may load quickly on one device but perform poorly on another because of differences in network speed, browser behavior, device capabilities, and user location. Synthetic tests can identify many performance problems, but they cannot fully represent every experience real visitors encounter.
Real User Monitoring (RUM) helps teams understand how actual users experience websites and applications. By collecting performance and interaction data from real sessions, RUM tools help developers identify slow pages, JavaScript errors, navigation problems, and usability issues.
RUM is an important capability for frontend developers, digital businesses, DevOps teams, and site reliability engineers who want to improve website performance and user satisfaction.
What Are Real User Monitoring (RUM) Tools?
Real User Monitoring tools collect performance and experience data from actual users as they interact with a website or application. Data is typically gathered through browser instrumentation, mobile SDKs, or other client-side monitoring mechanisms.
Depending on the tool, collected information may include page-load timing, navigation performance, interaction responsiveness, frontend errors, browser types, device categories, and geographic or network-related dimensions.
For example, an online store may discover that its product pages load quickly on desktop computers but slowly on mobile devices. RUM data can help the team identify the affected pages, browsers, and user groups.
Unlike synthetic monitoring, which uses scripted tests, RUM measures experiences from real sessions. The two approaches complement each other: synthetic monitoring provides controlled, repeatable tests, while RUM reveals what users actually experience.
Why Is Real User Monitoring Important?
RUM gives teams insight into performance under real-world conditions.
- Real-world performance visibility: Understand how pages perform across different devices, browsers, and network conditions.
- Better user experience: Identify slow page loads, delayed interactions, and navigation problems.
- Frontend error detection: Find JavaScript exceptions and other client-side failures affecting visitors.
- Performance optimization: Identify pages and user journeys that need improvement.
- Business impact analysis: Examine how performance relates to conversion funnels and other measurable outcomes, where suitable analytics are available.
- Release validation: Detect performance regressions after frontend deployments.
- Data-driven decisions: Prioritize improvements using observed user experiences instead of assumptions.
How Does RUM Work?
1. Instrumentation
A monitoring script, browser agent, SDK, or supported integration collects performance information from the user’s browser or application.
2. Data Collection
The tool records supported events, such as navigation timing, resource loading, page interactions, errors, and session information.
3. Data Transmission
Collected telemetry is sent to a monitoring platform for processing and analysis. Implementations may use sampling or batching to manage overhead and data volume.
4. Aggregation and Analysis
The platform groups data by dimensions such as page, browser, device, region, or release version. This helps teams identify performance patterns and affected user segments.
5. Dashboards and Alerts
Dashboards display performance trends and error information. Depending on the product, teams can configure alerts for sustained degradation or significant changes.
6. Troubleshooting and Optimization
Engineers investigate affected pages and user journeys, then optimize JavaScript, images, network requests, caching, or other contributing factors.
Important RUM Metrics
Understanding the right metrics helps teams evaluate the experience of real users.
| Metric | What It Measures | Why It Matters |
|---|---|---|
| Largest Contentful Paint (LCP) | Time until the largest visible content element is rendered | Indicates perceived loading performance |
| Interaction to Next Paint (INP) | Responsiveness across user interactions | Helps identify delayed interface responses |
| Cumulative Layout Shift (CLS) | Unexpected movement of visible page content | Measures visual stability |
| First Contentful Paint (FCP) | Time until the first content appears | Indicates when users first see page content |
| Page-load timing | Browser navigation and loading milestones | Helps investigate slow page loads |
| JavaScript error rate | Frequency of client-side errors | Identifies frontend reliability problems |
| Resource load time | Time taken to load scripts, images, fonts, and other resources | Helps locate slow or failing resources |
| Session and navigation metrics | Behavior across supported user journeys | Helps identify where users encounter problems |
LCP, INP, and CLS are Google’s Core Web Vitals. Their values should be interpreted using the applicable measurement definitions and thresholds. For Core Web Vitals, the commonly used assessment is based on the 75th percentile of page visits, evaluated separately for mobile and desktop where data is available.
Popular Real User Monitoring Tools
1. Datadog RUM
Datadog Real User Monitoring helps teams analyze browser and mobile application performance, frontend errors, user sessions, and performance trends. It can connect client-side data with backend traces and other observability signals when configured appropriately.
Best suited for: Teams that want real user experience monitoring integrated with application and infrastructure observability.
2. New Relic Browser
New Relic Browser provides browser-side performance monitoring, JavaScript error visibility, and analysis of page-load behavior. It can help teams investigate frontend issues alongside other application telemetry.
Best suited for: Development teams that want browser monitoring within a broader application performance platform.
3. Dynatrace RUM
Dynatrace provides real user monitoring capabilities for supported web and application environments, with performance analysis and integration into its broader observability platform.
Best suited for: Enterprises that need user experience insights connected to application and infrastructure monitoring.
4. Elastic RUM
Elastic RUM supports browser-side monitoring and can help collect frontend performance data and errors for analysis within the Elastic ecosystem.
Best suited for: Teams already using Elastic tools for observability and data analysis.
5. Sentry
Sentry focuses on application error tracking and performance monitoring. Its browser and frontend capabilities can help developers investigate JavaScript errors, slow transactions, and problems affecting user sessions.
Best suited for: Development teams that prioritize frontend error diagnosis and application performance troubleshooting.
6. Microsoft Clarity
Microsoft Clarity provides website behavior analytics, including session recordings and heatmaps. It is useful for understanding how visitors interact with page elements, but it is not a full replacement for a dedicated RUM platform with comprehensive performance telemetry.
Best suited for: Website owners and user experience teams seeking behavioral insights to complement performance monitoring.
7. Google Analytics 4
Google Analytics 4 provides web and app analytics, including events, engagement, and conversion reporting. It can help teams understand user journeys and business outcomes, but it should not be treated as a dedicated RUM solution for detailed browser performance diagnostics.
Best suited for: Teams analyzing user behavior and conversions alongside separate performance monitoring tools.
RUM Tool Comparison
| Tool | Key Strength | Common Use Case |
|---|---|---|
| Datadog RUM | Integrated frontend and backend observability | Web applications and digital services |
| New Relic Browser | Browser performance and error analysis | Frontend troubleshooting |
| Dynatrace RUM | User experience monitoring in enterprise observability | Large application environments |
| Elastic RUM | Integration with Elastic analytics | Teams using the Elastic ecosystem |
| Sentry | Frontend errors and performance investigation | Software development teams |
| Microsoft Clarity | Session recordings and heatmaps | User behavior analysis |
| Google Analytics 4 | Engagement and conversion analytics | Digital analytics |
These products have different purposes and levels of performance-monitoring depth. Before selecting a solution, verify its current browser support, data collection capabilities, privacy controls, integrations, and pricing.
Essential Features to Look For
When evaluating a RUM platform, consider these capabilities:
- Browser performance metrics: Collect relevant navigation and resource timing data.
- Core Web Vitals: Measure LCP, INP, and CLS where supported.
- Frontend error tracking: Identify JavaScript exceptions and failed resources.
- Session analysis: Investigate user journeys and performance issues across interactions.
- Device and browser segmentation: Compare experiences across supported environments.
- Geographic and network analysis: Identify location or connection-related performance differences where data is available.
- Release tracking: Compare performance and error rates across software versions.
- Backend correlation: Connect browser problems with backend traces and service performance.
- Dashboards and alerting: Monitor trends and detect meaningful regressions.
- Privacy controls: Manage consent, data minimization, masking, and retention appropriately.
How to Choose the Right RUM Tool
Step 1: Define Your Goals
Decide whether your priority is Core Web Vitals, JavaScript errors, mobile experience, checkout performance, or broader user journey analysis.
Step 2: Identify Your Platforms
Check support for your frontend framework, browsers, mobile applications, and deployment architecture.
Step 3: Evaluate Data Quality
Determine which metrics and session details the tool collects, how it handles sampling, and whether it provides enough information to investigate problems.
Step 4: Check Backend Integrations
If you need to understand why a page is slow, look for ways to connect browser timing with API requests, backend traces, logs, and infrastructure metrics.
Step 5: Review Privacy and Compliance
Assess consent handling, personal data collection, session recording controls, data residency, retention, and access permissions.
Step 6: Compare Costs
Evaluate pricing based on sessions, events, data volume, retention, and additional monitoring capabilities. Estimate costs using realistic traffic levels.
Step 7: Run a Practical Trial
Instrument a representative page, examine real performance data, investigate a frontend error, and test whether the platform helps the team identify useful improvements.
RUM Best Practices
- Track real user experience: Analyze performance across actual sessions rather than relying only on laboratory tests.
- Monitor Core Web Vitals: Use LCP, INP, and CLS to understand important aspects of loading, responsiveness, and visual stability.
- Segment performance data: Compare mobile and desktop experiences, browsers, page types, and relevant user groups.
- Prioritize important journeys: Monitor critical paths such as sign-up, login, search, and checkout.
- Track software releases: Compare performance and errors before and after deployments.
- Correlate frontend and backend data: Investigate whether slow pages are associated with API latency or server-side issues.
- Configure meaningful alerts: Focus on sustained degradation and significant user impact.
- Manage collection overhead: Test instrumentation and sampling to balance visibility with performance and cost.
- Protect user privacy: Avoid collecting sensitive form values, passwords, payment information, or unnecessary personal data.
- Review trends regularly: Use RUM findings to prioritize and validate performance improvements.
Common RUM Challenges
RUM data can be difficult to interpret when traffic is limited, instrumentation is incomplete, or sampling excludes important sessions. Performance also varies across browsers, devices, geographic regions, and network conditions, so an overall average may hide problems affecting a smaller group of users.
Privacy requirements can limit what session details may be collected. Teams should configure collection carefully, use suitable aggregation and sampling methods, and avoid treating correlations as proof of causation.
Combining RUM with synthetic tests, backend monitoring, and distributed tracing provides a more complete picture of application performance.
Conclusion
Real User Monitoring tools help organizations understand how websites and applications perform for actual visitors. Platforms such as Datadog RUM, New Relic Browser, Dynatrace RUM, Elastic RUM, and Sentry provide different approaches to frontend performance and error analysis, while tools such as Microsoft Clarity and Google Analytics 4 can complement RUM with behavioral and conversion insights.
The best solution should match your monitoring goals, technical stack, privacy requirements, and budget. By monitoring real user experiences, tracking Core Web Vitals, investigating frontend errors, and connecting browser data with backend telemetry, teams can make informed improvements to performance and user satisfaction.
