Upgrade & Secure Your Future with DevOps, SRE, DevSecOps, MLOps!
We spend hours scrolling social media and waste money on things we forget, but won’t spend 30 minutes a day earning certifications that can change our lives.
Master in DevOps, SRE, DevSecOps & MLOps by DevOps School!
Learn from Guru Rajesh Kumar and double your salary in just one year.
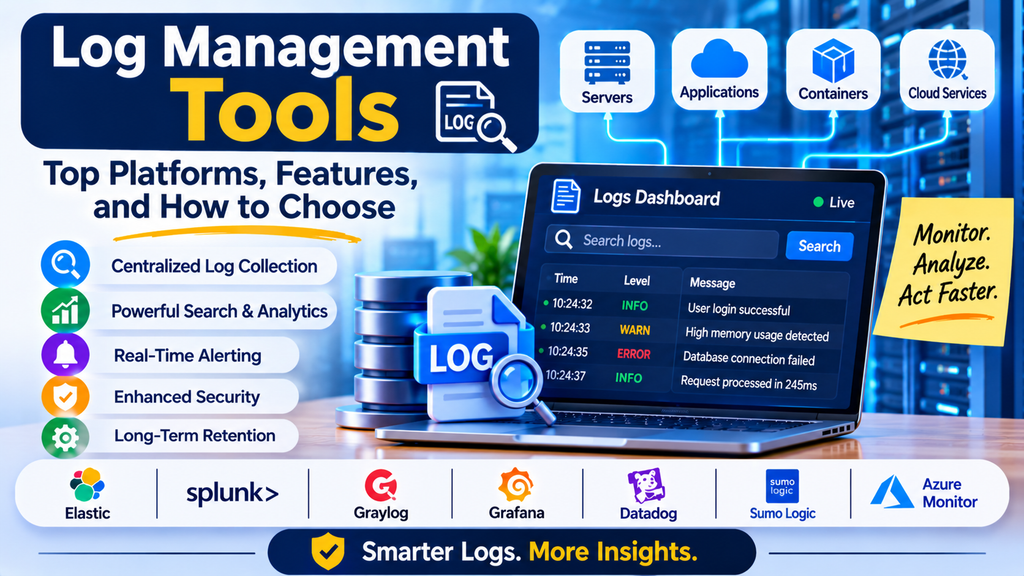
Modern applications generate large amounts of log data from servers, databases, containers, APIs, cloud services, and application code. These logs help engineers understand system behavior, investigate errors, identify security concerns, and troubleshoot operational problems. However, managing logs manually becomes difficult as applications grow and infrastructure becomes more distributed.
Log management tools help organizations collect, centralize, search, analyze, store, and monitor log data from different sources. They play an important role in DevOps, cybersecurity, cloud operations, and site reliability engineering (SRE).
What Are Log Management Tools?
Log management tools are software platforms that gather log records from applications, operating systems, servers, networks, databases, and cloud infrastructure. They organize the records so teams can search, filter, analyze, and use them to investigate issues.
A log entry may contain a timestamp, severity level, service name, request identifier, and event message. By examining this information, engineers can understand what happened before, during, and after a system failure.
For example, if an API starts returning errors, a log management platform can help developers find the relevant error messages, identify affected requests, and investigate whether the problem began after a recent deployment.
Why Is Log Management Important?
Effective log management gives technical teams a reliable way to understand system activity and troubleshoot incidents.
- Centralized visibility: Collect logs from multiple systems in one searchable location.
- Faster troubleshooting: Find error messages and investigate incidents without manually checking every server.
- Security monitoring: Analyze authentication failures, suspicious events, and unusual activity.
- Operational reliability: Identify recurring errors and patterns that may indicate system instability.
- Compliance support: Retain and retrieve relevant records according to organizational and regulatory requirements.
- Application debugging: Understand application behavior and investigate failures in production.
- Better collaboration: Give developers, operations teams, and security professionals access to relevant log evidence.
Log management supports incident investigation, but it should be combined with appropriate security controls and other monitoring signals for a complete operational picture.
How Does Log Management Work?
1. Log Collection
Logs are gathered from applications, servers, containers, databases, network devices, and cloud services. Collection may use agents, APIs, native integrations, or log forwarding systems.
2. Log Aggregation
Logs from multiple sources are sent to a centralized platform or storage system. Centralization makes it easier to investigate events across different components.
3. Parsing and Normalization
The platform extracts useful fields from raw log records and organizes them into a consistent structure. Standardized fields improve filtering, searching, and analysis.
4. Indexing and Storage
Depending on the platform, logs may be indexed or organized for efficient querying. Retention policies determine how long records remain available.
5. Search and Analysis
Users can filter logs by time range, service, severity, error code, host, or other attributes. Some tools also provide dashboards, visualizations, and correlation features.
6. Alerting and Reporting
Teams configure alerts for specific log patterns or abnormal event rates. Reports and dashboards help them identify recurring problems and understand operational trends.
Popular Log Management Tools
1. Elastic Stack (ELK Stack)
The Elastic Stack includes Elasticsearch, Logstash, and Kibana, along with other data collection and processing components. It is widely used for centralized log storage, searching, analysis, and visualization.
Best suited for: Organizations that want customizable log analytics and flexible search capabilities.
2. Splunk
Splunk provides log search, analysis, dashboards, alerting, and operational data analytics. Its broader product ecosystem also supports security monitoring and investigation use cases.
Best suited for: Enterprises that need powerful log analytics across complex IT environments.
3. Graylog
Graylog provides centralized log collection, searching, dashboards, and alerting. Its capabilities and deployment options vary by edition.
Best suited for: Teams seeking a dedicated log management workflow with centralized search and analysis.
4. Datadog Log Management
Datadog Log Management integrates log collection and analysis with application performance and infrastructure monitoring. This can help teams connect log events with other operational signals.
Best suited for: Cloud-native teams that want logs alongside metrics, traces, and infrastructure data.
5. Grafana Loki
Grafana Loki is a log aggregation system designed to work with the Grafana ecosystem. It indexes labels associated with log streams rather than indexing every line of log content in the same way as a full-text search engine.
Best suited for: Teams using Grafana who want a label-based log aggregation and querying solution.
6. Google Cloud Logging
Google Cloud Logging collects and analyzes log data from Google Cloud services and supported application environments. It integrates with other Google Cloud operations capabilities.
Best suited for: Organizations running workloads on Google Cloud.
7. Amazon CloudWatch Logs
Amazon CloudWatch Logs helps users collect, monitor, and analyze logs from supported AWS services and applications. It supports queries, metric filters, and integrations with AWS monitoring workflows.
Best suited for: Teams operating applications and infrastructure within AWS.
8. Microsoft Azure Monitor Logs
Azure Monitor Logs provides log collection and analysis capabilities for Azure resources and supported connected environments. Users can query log data through the platform’s analytics capabilities.
Best suited for: Organizations that rely on Microsoft Azure for infrastructure and application operations.
Log Management Tool Comparison
| Tool | Key Strength | Common Use Case |
|---|---|---|
| Elastic Stack | Flexible search and analytics | Custom log analysis |
| Splunk | Enterprise log analytics | Complex IT and security environments |
| Graylog | Centralized log management | Operational troubleshooting |
| Datadog | Integrated observability | Cloud-native applications |
| Grafana Loki | Label-based log aggregation | Grafana-based monitoring stacks |
| Google Cloud Logging | Google Cloud integration | GCP workloads |
| Amazon CloudWatch Logs | AWS integration | AWS applications and services |
| Azure Monitor Logs | Azure integration | Azure infrastructure and applications |
The right solution depends on the technology stack, expected log volume, query requirements, retention needs, security controls, and budget. Features and pricing may vary by product edition and change over time.
Essential Features to Look For
When selecting a log management tool, consider the following capabilities:
- Multiple source integrations: Support for applications, servers, databases, containers, and cloud services.
- Centralized collection: Ability to consolidate logs from distributed systems.
- Search and filtering: Efficiently locate relevant events using timestamps, fields, and query languages.
- Structured log support: Handle formats such as JSON and extract useful fields from unstructured records.
- Dashboards and visualizations: Present errors, trends, and operational patterns clearly.
- Alerting: Notify teams when specific events or abnormal log patterns occur.
- Retention management: Set retention periods according to operational, legal, and compliance needs.
- Access control: Restrict access to sensitive logs using suitable permissions.
- Scalability: Handle increasing data volume and query demand.
- Cost visibility: Understand ingestion, storage, indexing, and query-related costs.
How to Choose the Right Log Management Tool
Step 1: Identify Your Requirements
Decide whether your primary goal is application debugging, infrastructure troubleshooting, security investigation, compliance, or a combination of these needs.
Step 2: Understand Your Log Sources
List your applications, operating systems, databases, cloud platforms, and container environments. Check whether candidate tools can collect logs from these sources.
Step 3: Evaluate Search Performance
Test common investigation tasks, such as finding errors within a time window, filtering by service, and tracking a request across multiple components.
Step 4: Estimate Total Cost
Review ingestion charges, storage, indexing, retention, data transfer, and licensing. Estimate costs using realistic log volumes rather than small test workloads.
Step 5: Review Security and Compliance
Check access controls, encryption, auditability, retention settings, data residency requirements, and options for masking sensitive fields.
Step 6: Run a Proof of Concept
Send representative logs to the platform and test collection reliability, parsing, query speed, alerting, and dashboard usability.
Step 7: Plan for Growth
Choose an approach that can support future applications, increased traffic, additional cloud services, and changing retention requirements.
Log Management Best Practices
- Standardize log formats: Use consistent field names, timestamps, severity levels, and service identifiers.
- Use structured logging: Prefer structured records such as JSON where appropriate to improve search and analysis.
- Set meaningful log levels: Use DEBUG, INFO, WARN, and ERROR consistently to control detail and simplify investigations.
- Centralize important logs: Collect records from critical applications and infrastructure components.
- Create actionable alerts: Focus on important error patterns and sudden changes rather than alerting on every event.
- Apply retention policies: Keep logs for as long as operational, legal, and compliance requirements justify.
- Protect sensitive information: Avoid recording passwords, access tokens, payment details, or unnecessary personal data.
- Monitor ingestion health: Verify that log collection pipelines are functioning and not silently dropping records.
- Control costs: Review noisy sources, redundant events, indexing choices, and storage consumption.
- Correlate logs with other telemetry: Use request IDs, trace IDs, metrics, and deployment events to investigate issues more efficiently.
Common Log Management Challenges
Organizations may struggle with excessive log volume, inconsistent formats, incomplete collection, slow searches, and rising storage costs. Sensitive information may also be exposed if logs are collected without appropriate filtering or access controls.
Another challenge is noise: large numbers of low-value events can make important errors difficult to identify. Teams can address this by defining logging standards, filtering unnecessary data, applying retention policies, validating ingestion pipelines, and regularly reviewing alert quality.
Conclusion
Log management tools help organizations turn raw event records into useful operational information. Platforms such as Elastic Stack, Splunk, Graylog, Datadog, Grafana Loki, Google Cloud Logging, Amazon CloudWatch Logs, and Azure Monitor Logs provide different approaches to collection, search, analysis, and alerting.
The best solution should fit your infrastructure, provide efficient investigation workflows, protect sensitive information, and keep costs manageable as log volumes grow. With standardized logging and well-designed retention and alerting policies, teams can troubleshoot faster, improve reliability, and strengthen operational visibility.
