Upgrade & Secure Your Future with DevOps, SRE, DevSecOps, MLOps!
We spend hours scrolling social media and waste money on things we forget, but won’t spend 30 minutes a day earning certifications that can change our lives.
Master in DevOps, SRE, DevSecOps & MLOps by DevOps School!
Learn from Guru Rajesh Kumar and double your salary in just one year.
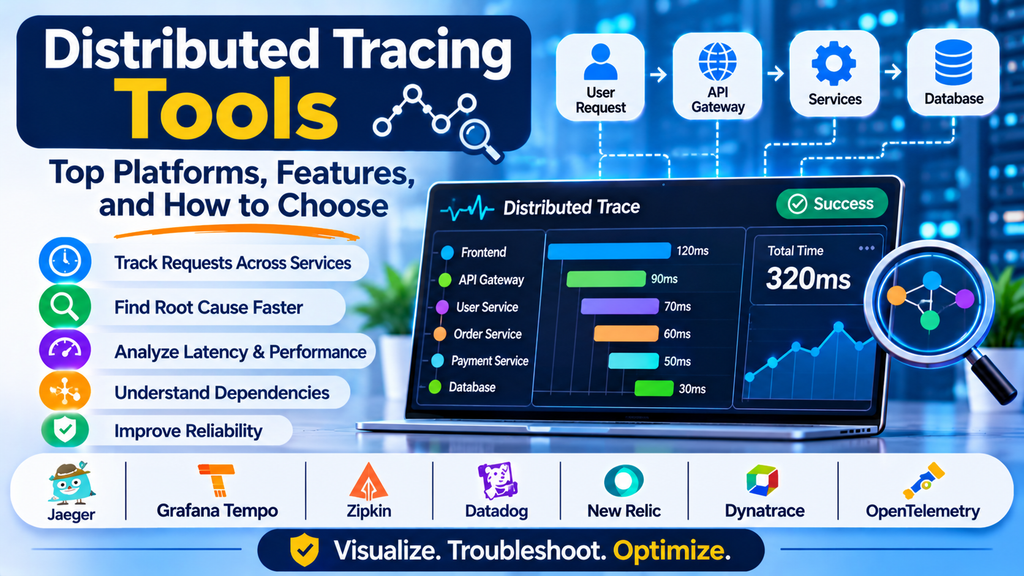
Distributed Tracing Tools: Top Platforms, Features, and How to Choose
Modern applications often consist of multiple microservices that communicate through APIs, databases, message queues, and external services. When a request becomes slow or fails, finding the responsible component can be difficult because the request may pass through many systems before reaching its destination.
Distributed tracing tools help developers and operations teams follow requests across these interconnected services. They provide visibility into the sequence of operations, the time spent in each component, and the relationships between services. This makes distributed tracing an important capability in DevOps, cloud-native development, and site reliability engineering (SRE).
What Are Distributed Tracing Tools?
Distributed tracing tools capture and visualize the journey of a request as it travels through multiple services in a distributed application.
A trace represents the complete journey of a request, while spans represent individual operations within that journey. Each span can contain information such as its duration, service name, operation, status, and related metadata.
For example, when a customer places an order, the request may pass through an API gateway, an order service, a payment service, and a database. A distributed tracing tool helps engineers determine which operation introduced latency or caused an error.
Why Is Distributed Tracing Important?
Distributed tracing improves visibility into systems where a single transaction involves multiple services.
- Faster root-cause analysis: Identify which service or operation is responsible for a slow request.
- End-to-end request visibility: Follow transactions across service boundaries.
- Performance optimization: Discover slow database calls, external API requests, and inefficient service interactions.
- Microservices troubleshooting: Understand dependencies between distributed components.
- Improved reliability: Investigate failures and recurring latency problems.
- Better collaboration: Give development, DevOps, and SRE teams a shared view of request behavior.
- Deployment analysis: Compare traces before and after a release to identify possible regressions.
How Does Distributed Tracing Work?
1. Request Instrumentation
Applications are instrumented to record operations as requests pass through services. Instrumentation can use automatic agents, libraries, or manual code changes.
2. Trace and Span Creation
A trace groups the operations associated with a request. Each operation creates a span that records details such as its start time, duration, and service identity.
3. Context Propagation
Trace context is passed between services so that spans generated by different components can be associated with the same request. Missing or incorrectly propagated context can break the trace.
4. Trace Collection
Instrumentation sends trace data to a collector or tracing backend. Collectors can receive, process, and export telemetry to compatible destinations.
5. Visualization and Analysis
The tracing interface displays spans in a timeline or trace tree. Engineers can inspect service dependencies, identify long-running operations, and investigate errors.
6. Correlation With Other Telemetry
Traces can be connected with logs, metrics, deployment events, and application monitoring data. This additional context can help teams understand why a request became slow or failed.
Popular Distributed Tracing Tools
1. Jaeger
Jaeger is an open-source distributed tracing platform originally developed for tracing requests across distributed systems. It supports trace collection, storage integrations, visualization, and performance investigation.
Best suited for: Teams looking for an open-source tracing solution for microservices and distributed applications.
2. Grafana Tempo
Grafana Tempo is a distributed tracing backend designed to work with the Grafana observability ecosystem. It can connect trace exploration with metrics and logs from compatible data sources.
Best suited for: Teams using Grafana who want scalable trace storage and integrated observability workflows.
3. Zipkin
Zipkin is an open-source distributed tracing system that helps collect and visualize timing data from distributed applications.
Best suited for: Teams seeking a straightforward tracing solution for understanding service latency and request dependencies.
4. Datadog APM
Datadog APM provides distributed tracing alongside application performance monitoring, service maps, and related telemetry analysis.
Best suited for: Organizations that want managed tracing integrated with infrastructure and application monitoring.
5. Dynatrace
Dynatrace offers distributed tracing and application observability capabilities with automated dependency discovery and AI-assisted analysis features.
Best suited for: Enterprises managing complex applications and large service environments.
6. New Relic
New Relic provides distributed tracing capabilities that help teams analyze request paths, transaction timing, service interactions, and errors.
Best suited for: Development teams looking for tracing alongside application performance and error analysis.
7. Elastic APM
Elastic APM supports distributed traces and transaction analysis within the Elastic ecosystem, allowing teams to investigate application behavior alongside other operational data.
Best suited for: Teams already using Elastic for log search and observability.
8. OpenTelemetry
OpenTelemetry is an open-source framework for instrumenting, collecting, and exporting telemetry, including distributed traces. It supports vendor-neutral instrumentation and multiple compatible backends.
Best suited for: Teams that want standardized tracing instrumentation and flexibility in choosing a tracing backend.
OpenTelemetry is not itself a complete trace storage and visualization platform. It is commonly used with a backend such as Jaeger, Grafana Tempo, or a commercial observability service.
Distributed Tracing Tool Comparison
| Tool | Key Strength | Common Use Case |
|---|---|---|
| Jaeger | Open-source tracing and trace exploration | Microservices troubleshooting |
| Grafana Tempo | Scalable tracing integrated with Grafana | Cloud-native observability |
| Zipkin | Straightforward trace visualization | Distributed request analysis |
| Datadog APM | Managed tracing and integrated monitoring | Cloud applications |
| Dynatrace | Automated dependency discovery | Enterprise environments |
| New Relic | Tracing with application performance analysis | Application troubleshooting |
| Elastic APM | Tracing with Elastic analytics | Combined log and trace analysis |
| OpenTelemetry | Vendor-neutral instrumentation | Standardized telemetry collection |
The best option depends on trace volume, storage requirements, existing observability tools, deployment preferences, and the team’s technical expertise. Capabilities and pricing vary by product and edition.
Essential Features to Look For
When evaluating a distributed tracing platform, consider the following features:
- End-to-end tracing: Follow requests across services and external dependencies.
- Trace visualization: Explore spans through timelines, trees, and service maps.
- Latency analysis: Identify slow operations and compare timing across services.
- Error visibility: Inspect failed spans and relevant exception information.
- Context propagation: Support consistent trace context across services and communication protocols.
- Search and filtering: Find traces using service names, durations, status codes, or other attributes.
- Telemetry correlation: Connect traces with relevant logs, metrics, and infrastructure information.
- Sampling controls: Manage the volume and cost of collected trace data.
- Scalability: Handle increasing request volumes and service counts.
- Security and access controls: Protect trace data and restrict access where necessary.
How to Choose the Right Distributed Tracing Tool
Step 1: Understand Your Architecture
Identify the services, programming languages, communication protocols, and infrastructure that make up your application.
Step 2: Check Instrumentation Support
Confirm that the tool supports your application stack and can capture meaningful spans across service boundaries.
Step 3: Evaluate Context Propagation
Test whether trace identifiers remain consistent when requests pass through APIs, asynchronous messaging systems, and other service integrations.
Step 4: Compare Storage and Sampling
Estimate expected trace volume and review retention, indexing, sampling, and storage options. These factors can influence both performance and cost.
Step 5: Test Troubleshooting Workflows
Simulate a slow request or failed service call. Check how easily engineers can identify the affected component and inspect related operations.
Step 6: Review Integrations
Evaluate compatibility with existing dashboards, log management tools, metrics platforms, incident workflows, and deployment pipelines.
Step 7: Consider Operational Effort
Compare managed services with self-hosted solutions. Include setup, maintenance, upgrades, access controls, and ongoing administration in your decision.
Distributed Tracing Best Practices
- Instrument critical paths first: Start with important customer journeys and high-value services.
- Standardize trace context: Use consistent propagation across service boundaries.
- Adopt open standards where useful: OpenTelemetry can simplify instrumentation across different tools.
- Use appropriate sampling: Collect enough traces to investigate problems without creating unnecessary cost or overhead.
- Add meaningful span attributes: Include useful service, operation, and environment details while avoiding sensitive data.
- Monitor latency percentiles: Examine slow requests, not just average response times.
- Correlate traces with logs and metrics: Use trace IDs and related attributes to connect evidence from different sources.
- Instrument asynchronous operations: Account for message queues and background processing where relevant.
- Review high-latency services regularly: Use tracing findings to prioritize optimization work.
- Protect trace data: Avoid capturing passwords, authentication tokens, payment information, or unnecessary personal details.
Common Distributed Tracing Challenges
Distributed tracing can be difficult to implement when applications use many languages, inconsistent instrumentation, or protocols that do not propagate context correctly. Large trace volumes may increase storage and processing costs, while poorly chosen sampling rules can omit traces needed for investigations.
Another challenge is trace interpretation: a long trace does not automatically identify the root cause. Engineers need to understand service dependencies, application behavior, and relevant logs and metrics to draw accurate conclusions.
Teams can reduce these challenges by standardizing instrumentation, testing context propagation, applying sensible sampling policies, and integrating tracing into established troubleshooting workflows.
Conclusion
Distributed tracing tools provide visibility into requests that travel through complex applications and microservices. Solutions such as Jaeger, Grafana Tempo, Zipkin, Datadog APM, Dynatrace, New Relic, and Elastic APM offer different approaches to trace collection and analysis, while OpenTelemetry provides a flexible foundation for instrumentation.
Choose a solution that fits your architecture, handles your trace volume, integrates with existing monitoring tools, and helps engineers investigate issues efficiently. With consistent instrumentation and effective telemetry correlation, distributed tracing can improve troubleshooting, optimize application performance, and support more reliable services.
