Upgrade & Secure Your Future with DevOps, SRE, DevSecOps, MLOps!
We spend hours scrolling social media and waste money on things we forget, but won’t spend 30 minutes a day earning certifications that can change our lives.
Master in DevOps, SRE, DevSecOps & MLOps by DevOps School!
Learn from Guru Rajesh Kumar and double your salary in just one year.
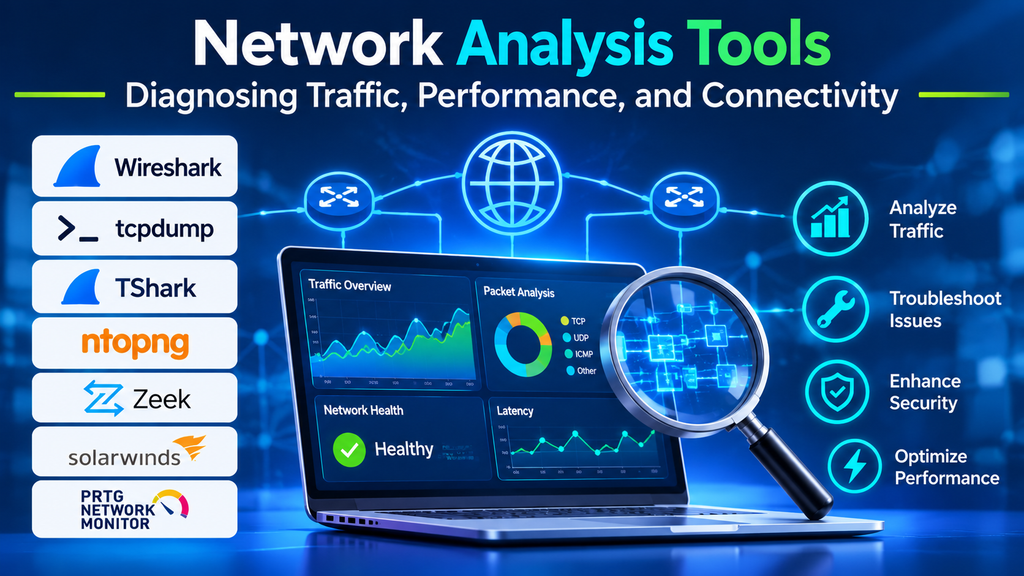
Network analysis helps IT professionals understand how data moves across networks, how devices communicate, and why connectivity or performance problems occur. When users experience slow applications, intermittent connections, packet loss, or unexpected traffic, network analysis tools provide the evidence needed to investigate the underlying cause.
Unlike basic network monitoring, which primarily tracks availability and performance over time, network analysis often examines traffic flows, packet contents, protocols, communication patterns, and network behavior in greater detail. Many IT teams use both approaches together: monitoring identifies when a problem occurs, while analysis helps explain what is happening.
What Are Network Analysis Tools?
Network analysis tools are software applications that inspect network traffic and communication data to help administrators troubleshoot problems, understand utilization, validate configurations, and investigate suspicious activity.
Depending on the tool, analysis may use packet captures, flow records, protocol statistics, connection metadata, device logs, or synthetic tests.
Common capabilities include:
- Packet capture and protocol inspection.
- Traffic-flow analysis and bandwidth investigation.
- Latency, retransmission, and connection troubleshooting.
- DNS, TCP, HTTP, and other protocol analysis.
- Network path and connectivity diagnostics.
- Identification of communication patterns and unusual traffic.
- Exportable reports for troubleshooting and documentation.
Not every tool provides all these capabilities. Packet analyzers, flow analyzers, and connectivity diagnostic utilities serve related but distinct purposes.
Why Network Analysis Matters
Troubleshooting slow applications
Application performance depends on more than server health. Delayed responses, retransmissions, connection setup problems, and network congestion can all contribute to a poor user experience. Analysis helps teams distinguish network-related symptoms from application or infrastructure issues.
Understanding traffic behavior
Traffic analysis can reveal which systems communicate, which protocols are in use, and where bandwidth is being consumed. This information helps administrators investigate congestion and understand network utilization.
Diagnosing connectivity problems
Protocol-level evidence can help identify failed handshakes, DNS resolution problems, connection resets, and other communication failures.
Supporting security investigations
Network analysis can reveal unexpected destinations, unusual communication patterns, or suspicious protocol behavior. It can contribute to incident response, but it should be combined with appropriate security monitoring and investigation procedures.
Validating network changes
After changing routing, firewall rules, DNS settings, or application configurations, teams can use analysis tools to verify that communication follows the expected path and protocols behave correctly.
Popular Network Analysis Tools
1. Wireshark
Wireshark is a widely used packet analyzer that allows users to capture and inspect network traffic at the protocol level. It supports detailed examination of packets, conversations, retransmissions, handshakes, and protocol fields.
It is particularly useful when a problem requires evidence about what occurred during a communication session. Because packet captures may contain sensitive information, teams should use appropriate capture filters, access controls, and retention policies.
2. tcpdump
tcpdump is a command-line packet capture utility available on many Unix-like systems. It is useful for capturing traffic directly on servers, network interfaces, and troubleshooting hosts, particularly when a graphical interface is unavailable.
Its capture filters and command-line output support targeted investigations. Engineers can also save captures for later analysis in Wireshark or compatible tools. Careful filtering is important because unrestricted captures can be large and may collect sensitive data.
3. SolarWinds NetFlow Traffic Analyzer
SolarWinds NetFlow Traffic Analyzer focuses on flow-based traffic visibility using supported technologies such as NetFlow and related flow protocols. It helps teams investigate bandwidth usage, traffic sources, and communication patterns.
Flow analysis is valuable for understanding who is communicating with whom and how much traffic is being transferred. It generally does not provide the same packet-by-packet protocol detail as a packet analyzer.
4. ManageEngine NetFlow Analyzer
ManageEngine NetFlow Analyzer provides traffic-flow analysis and reporting for supported network environments. It can help administrators investigate bandwidth consumption, identify heavy traffic sources, and understand application or protocol usage where supported.
Before choosing it, verify compatibility with the devices and flow-export formats in your network, as well as the reporting and retention features available in the selected edition.
5. PRTG Network Monitor
PRTG provides broad infrastructure and network monitoring, with sensors and integrations that can support traffic analysis and troubleshooting. It is useful when teams want to connect network performance metrics with a broader view of device and service health.
Its analysis depth depends on the sensors, data sources, and integrations configured. For detailed packet inspection, a specialized packet analyzer may still be necessary.
6. Nmap
Nmap is a network discovery and security auditing tool used to identify hosts, inspect exposed ports, and examine services within an authorized scope. It helps administrators understand which systems are reachable and which services appear to be listening.
Nmap is not a full packet-analysis or continuous traffic-monitoring platform. Use it only on systems and networks you are authorized to assess, and follow organizational policies for scanning.
7. iperf3
iperf3 is a network performance measurement tool that tests throughput between endpoints. It is useful for assessing network capacity and investigating whether a path can deliver the expected data rate under test conditions.
Results depend on endpoint performance, test duration, protocol settings, congestion, and the network path. Tests should be planned carefully to avoid disrupting production traffic.
Comparing Network Analysis Tools
| Tool | Primary purpose | Best suited for |
|---|---|---|
| Wireshark | Graphical packet and protocol inspection | Detailed communication troubleshooting |
| tcpdump | Command-line packet capture | Targeted captures on servers and network hosts |
| SolarWinds NetFlow Traffic Analyzer | Flow-based traffic analysis | Bandwidth and traffic-source investigations |
| ManageEngine NetFlow Analyzer | Traffic-flow reporting and analysis | Network utilization analysis |
| PRTG Network Monitor | Monitoring with traffic-related visibility | Combined infrastructure and network monitoring |
| Nmap | Network discovery and service auditing | Authorized host and port discovery |
| iperf3 | Throughput testing | Measuring performance between endpoints |
These tools are complementary rather than interchangeable. A typical investigation might use a monitoring dashboard to identify an issue, flow analysis to locate the traffic source, Wireshark or tcpdump to inspect the relevant packets, and iperf3 to measure throughput between selected endpoints.
Essential Features to Consider
Packet capture and filtering
For packet-level troubleshooting, look for capture filters, display filters, protocol decoding, and the ability to save captures for later review.
Flow and bandwidth analysis
Flow-based tools should help identify high-volume sources, destination patterns, protocols, and interface utilization. Confirm which exporters and flow formats are supported.
Protocol visibility
The tool should expose the protocol details relevant to your environment, such as DNS, TCP, TLS metadata, HTTP, or application-specific communication where available.
Performance measurements
Useful metrics may include latency, retransmissions, packet loss, throughput, connection setup time, and response time. Different tools measure different parts of the communication path, so interpret results in context.
Reporting and integrations
Exportable reports, timestamps, filters, and integrations with monitoring or incident-management systems help teams document findings and share evidence.
Security and privacy
Packet data can expose credentials, personal information, internal hostnames, and application content. Review capture permissions, encryption, access controls, retention, and data-handling policies before collecting traffic.
How to Choose the Right Tool
Start with the question you need to answer. If you need to inspect a failed TCP handshake, a packet analyzer may be appropriate. If you need to identify which department or application is consuming bandwidth, a flow analyzer may be a better starting point. If you need to measure available throughput, a performance-testing utility may be more suitable.
Evaluate tools against these factors:
- Analysis depth: Do you need packet-level detail, flow summaries, service discovery, or performance tests?
- Environment compatibility: Does the tool work with your operating systems, devices, interfaces, and network architecture?
- Ease of use: Can the team interpret the output without excessive manual effort?
- Scale: Can it handle the capture volume, flow rate, and number of monitored locations?
- Integration: Can results be linked to existing monitoring and incident workflows?
- Cost and maintenance: Consider licensing, hardware, storage, training, and administration.
- Security: Ensure analysis is authorized and collected data is protected.
A small pilot using a known network issue can reveal whether the tool produces useful evidence in your actual environment.
Network Analysis Best Practices
Define the investigation scope. Identify the affected application, endpoints, time window, and network path before collecting data.
Capture only what is needed. Use appropriate filters and capture durations to reduce unnecessary data and limit privacy exposure.
Synchronize system clocks. Consistent timestamps make it easier to compare packet captures, server logs, application traces, and monitoring events.
Establish a baseline. Compare unusual behavior with normal traffic patterns and expected application behavior.
Use multiple evidence sources. Combine packet captures with flow records, device metrics, DNS logs, and application telemetry when appropriate.
Protect captured data. Store captures securely, restrict access, and delete them according to approved retention policies.
Document findings. Record the test conditions, filters, timestamps, observations, and corrective actions so that the investigation can be repeated.
Common Challenges in Network Analysis
Network analysis can generate large volumes of data, especially on high-throughput interfaces. Capturing everything may consume significant storage and make the relevant evidence harder to find. Targeted capture strategies help keep investigations manageable.
Encryption also limits visibility into application payloads. Even when content is encrypted, metadata and connection behavior may still provide useful clues, subject to the protocol and available telemetry.
Another challenge is distinguishing symptoms from causes. Retransmissions, latency, or high utilization may indicate a problem, but the underlying cause could be an overloaded endpoint, a congested link, a misconfiguration, or an issue elsewhere in the application path. Reliable conclusions require context and corroborating evidence.
Conclusion
Network analysis tools help IT teams investigate communication problems, understand traffic behavior, measure performance, and validate network changes. The right tool depends on whether the task requires packet inspection, flow analysis, network discovery, or throughput testing.
A practical approach is to combine continuous monitoring with targeted analysis. Define the problem, collect only the evidence needed, correlate findings across systems, and document the outcome. This makes troubleshooting more efficient while protecting sensitive network data.
