Upgrade & Secure Your Future with DevOps, SRE, DevSecOps, MLOps!
We spend hours scrolling social media and waste money on things we forget, but won’t spend 30 minutes a day earning certifications that can change our lives.
Master in DevOps, SRE, DevSecOps & MLOps by DevOps School!
Learn from Guru Rajesh Kumar and double your salary in just one year.
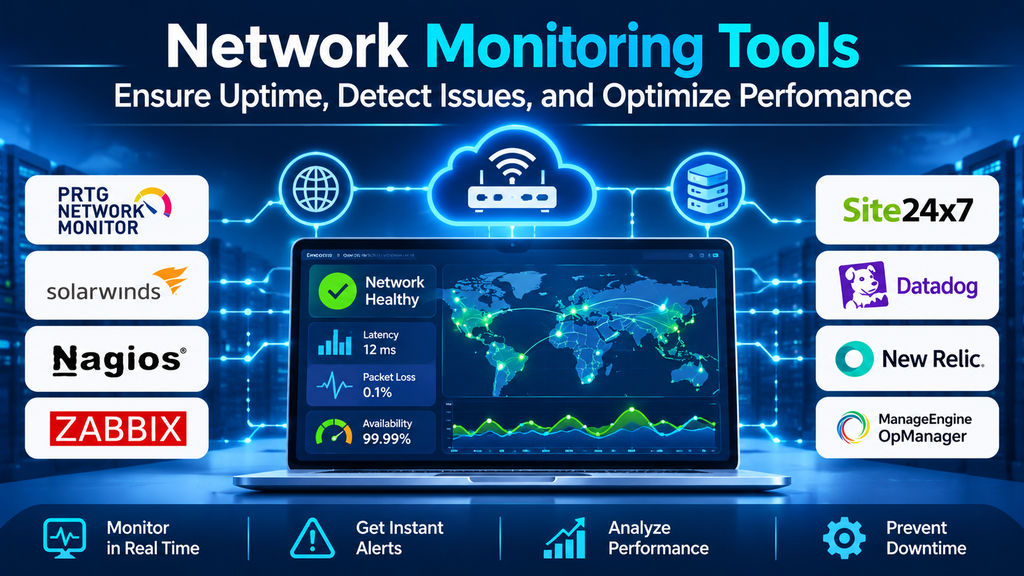
Network infrastructure connects users, applications, servers, cloud services, and business systems. When a network experiences congestion, packet loss, latency, or device failures, the impact can range from slow applications to complete service disruption. Network monitoring helps IT teams identify these issues, understand their causes, and maintain reliable connectivity.
Network monitoring tools collect and analyze information from routers, switches, firewalls, servers, wireless access points, and other connected systems. They provide visibility into network availability, bandwidth utilization, device health, traffic patterns, and performance trends.
What Are Network Monitoring Tools?
Network monitoring tools are software platforms that observe network devices and connections to detect faults, measure performance, and alert administrators when problems occur.
Depending on the product, monitoring data may come from SNMP, flow protocols such as NetFlow and sFlow, ping checks, logs, packet captures, APIs, or telemetry from cloud environments.
Common capabilities include:
- Device and interface availability monitoring.
- Bandwidth and network traffic analysis.
- Latency, jitter, and packet-loss measurement.
- Alerts for failures and unusual utilization.
- Network topology discovery and visualization.
- Historical reporting and performance trend analysis.
- Troubleshooting support for connectivity and application issues.
A monitoring platform is most effective when it covers the critical paths that support business applications, not simply the largest number of devices.
Why Network Monitoring Matters
Detect problems before users report them
Continuous monitoring can identify unreachable devices, overloaded interfaces, or deteriorating performance before an issue affects a large number of users. Timely alerts give administrators an opportunity to investigate and respond.
Maintain application performance
Applications depend on reliable network communication. High latency, packet loss, congestion, and unstable connections can make even healthy applications appear slow. Monitoring helps teams determine whether the network contributes to a performance problem.
Improve troubleshooting
Centralized dashboards and historical data help engineers compare events, identify affected devices, and narrow down where a problem began. This reduces the need to investigate every network component manually.
Plan capacity and control costs
Bandwidth trends and interface utilization help teams anticipate upgrades, review circuit requirements, and identify underused or overloaded links. Historical data also supports network redesign and capacity planning.
Support security and operational awareness
Unexpected traffic patterns or changes in device behavior can warrant investigation. Network monitoring can contribute useful operational signals, although it is not a replacement for dedicated security monitoring and threat detection.
Popular Network Monitoring Tools
1. SolarWinds Network Performance Monitor
SolarWinds Network Performance Monitor provides network device and interface monitoring, performance visualization, alerting, and troubleshooting capabilities. It is commonly evaluated by organizations that need centralized visibility across enterprise network infrastructure.
Assess its device coverage, polling requirements, alert configuration, reporting, and licensing against the scale and complexity of your network.
2. PRTG Network Monitor
PRTG Network Monitor uses configurable sensors to monitor devices, interfaces, services, and performance indicators. Its dashboards and notification options can help administrators build a monitoring view tailored to their environment.
Review sensor requirements, deployment architecture, licensing, and the amount of configuration needed to monitor critical systems effectively.
3. ManageEngine OpManager
ManageEngine OpManager monitors network devices and infrastructure components, including routers, switches, and servers. It provides performance dashboards, availability checks, alerts, and reporting to support day-to-day network operations.
It may suit teams looking for a centralized infrastructure monitoring platform. Verify the necessary device integrations, monitoring depth, and features included in the selected edition.
4. Zabbix
Zabbix is an open-source monitoring platform that supports network devices, servers, applications, and other monitored resources. It offers data collection, triggers, notifications, visualization, and historical analysis.
Zabbix can provide flexibility for teams that want control over configuration and deployment. The trade-off is the expertise needed to design templates, tune alerts, maintain the platform, and support its infrastructure.
5. Nagios XI
Nagios XI provides infrastructure and network monitoring with checks, alerting, dashboards, and reporting. Its monitoring approach can be extended through plugins to cover many devices and services.
Organizations should assess plugin availability, configuration complexity, support needs, and the effort required to maintain reliable checks across a growing environment.
6. Datadog Network Monitoring
Datadog provides network monitoring and observability capabilities for supported infrastructure and cloud environments. Depending on the product configuration, teams can investigate network performance, connectivity, dependencies, and related infrastructure signals.
It is worth considering where network visibility needs to connect with application and infrastructure monitoring. Validate the telemetry sources, required agents or integrations, and expected usage costs.
7. Wireshark
Wireshark is a network protocol analyzer used to inspect captured packets in detail. It is especially useful for investigating protocol behavior, retransmissions, handshakes, and other low-level communication problems.
Unlike a continuously managed enterprise monitoring platform, Wireshark is primarily a diagnostic tool for packet analysis. Captures can contain sensitive information, so access, storage, and sharing should follow organizational security policies.
Comparing Network Monitoring Tools
| Tool | Primary strength | Suitable use case |
|---|---|---|
| SolarWinds Network Performance Monitor | Enterprise network performance and device visibility | Centralized monitoring of larger networks |
| PRTG Network Monitor | Sensor-based monitoring and dashboards | Flexible monitoring across varied infrastructure |
| ManageEngine OpManager | Network and infrastructure monitoring | Day-to-day operations and alerting |
| Zabbix | Customizable, open-source monitoring | Teams seeking control over monitoring configuration |
| Nagios XI | Plugin-based monitoring and alerting | Environments requiring customizable checks |
| Datadog Network Monitoring | Network visibility alongside observability | Cloud and application-focused operations |
| Wireshark | Detailed packet and protocol analysis | Deep investigation of specific network problems |
These products do not all serve exactly the same purpose. Wireshark, for example, complements rather than replaces a continuous monitoring platform.
Essential Features to Evaluate
Device discovery and topology
Automatic discovery can reduce setup effort and help teams understand device relationships. Confirm that the platform accurately represents network dependencies and supports the devices and protocols in use.
Real-time alerts
Alerts should identify meaningful problems without overwhelming administrators. Look for configurable thresholds, severity levels, escalation options, and suppression or deduplication controls.
Bandwidth and traffic analysis
Interface utilization and flow-based visibility help reveal congestion, heavy traffic sources, and changing usage patterns. Confirm which traffic sources and protocols are supported.
Performance measurements
Latency, packet loss, availability, and other relevant metrics help establish whether the network meets operational requirements. Wireless and application-sensitive environments may need additional indicators such as jitter.
Historical reports and forecasting
Historical data supports incident investigation, trend analysis, and capacity planning. Forecasting features can be helpful, but estimates should be interpreted in the context of changing workloads and network design.
Integrations and access controls
Check compatibility with ticketing systems, collaboration tools, cloud platforms, and existing observability systems. Role-based access, auditability, and secure credential handling are also important.
How to Choose the Right Tool
Begin by documenting the network you need to monitor: device types, sites, cloud services, critical applications, bandwidth requirements, and operational responsibilities.
Then evaluate potential tools against these practical criteria:
- Coverage: Can the tool monitor the devices, interfaces, and network paths that matter?
- Deployment: Does it support the required on-premises, cloud, or hybrid architecture?
- Scale: Can it handle the number of devices, interfaces, sensors, and data points expected?
- Alert quality: Can teams configure actionable alerts and avoid excessive noise?
- Troubleshooting depth: Does it provide enough historical context and diagnostic detail?
- Ease of operation: Can the team configure, maintain, and use it effectively?
- Total cost: Consider licenses, infrastructure, storage, support, training, and administration.
- Security: Review access controls, credential storage, data handling, and audit capabilities.
Run a pilot using representative devices and real network conditions. Test both normal operations and realistic failure scenarios before rolling the platform out broadly.
Network Monitoring Best Practices
Monitor critical paths. Prioritize connections that support essential applications, business services, and remote sites.
Set meaningful thresholds. Use normal traffic patterns, service requirements, and known peak periods to configure alerts rather than relying on identical thresholds everywhere.
Reduce alert fatigue. Group related events, remove duplicate notifications, and define clear escalation rules.
Maintain accurate inventory. Keep device names, locations, ownership, interface descriptions, and dependencies up to date.
Use historical data. Review trends after incidents and use past utilization to inform upgrades and network changes.
Protect monitoring access. Restrict administrative privileges, secure credentials, and handle packet captures and logs as potentially sensitive data.
Test notifications and recovery procedures. Confirm that the right people receive critical alerts and that response runbooks remain usable.
Common Network Monitoring Challenges
Monitoring large environments can produce substantial amounts of data. Poorly tuned thresholds, duplicate alerts, and noisy devices may make important problems harder to notice. Teams should focus on actionable signals and periodically review alert quality.
Incomplete device coverage is another challenge. A monitoring dashboard may show that a router is reachable while missing problems on a specific interface or end-to-end path. Coverage should reflect how users and applications actually connect.
Finally, monitoring tools require ongoing maintenance. Firmware changes, network redesigns, new cloud services, and device replacements can make old thresholds and topology information inaccurate. Regular reviews help preserve the usefulness of the monitoring system.
Conclusion
Network monitoring tools help organizations maintain reliable connectivity, detect performance problems, troubleshoot incidents, and plan infrastructure improvements. The best choice depends on network size, device diversity, deployment model, troubleshooting requirements, and the team’s operational skills.
Start by identifying critical network paths and the problems that cause the greatest business impact. Pilot suitable tools, configure actionable alerts, and review real performance data before expanding coverage. A well-maintained monitoring strategy provides more value than a large deployment that generates alerts without helping teams make better decisions.
