Upgrade & Secure Your Future with DevOps, SRE, DevSecOps, MLOps!
We spend hours scrolling social media and waste money on things we forget, but won’t spend 30 minutes a day earning certifications that can change our lives.
Master in DevOps, SRE, DevSecOps & MLOps by DevOps School!
Learn from Guru Rajesh Kumar and double your salary in just one year.
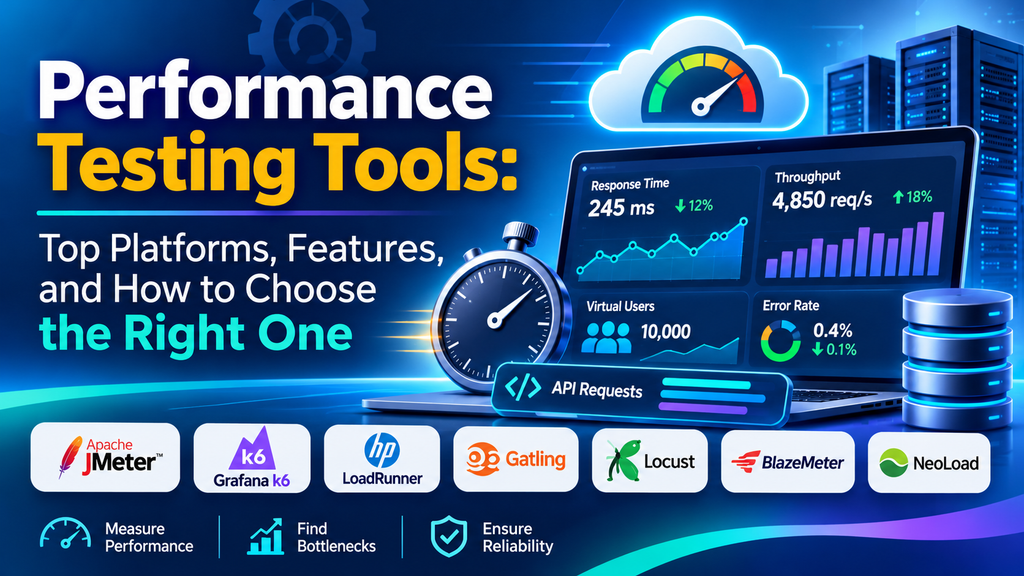
Performance testing tools help teams measure how applications, websites, APIs, and infrastructure behave under different workloads. They reveal response-time issues, throughput limitations, resource bottlenecks, and stability problems before these issues affect end users.
As applications become more complex, performance testing is an important part of quality assurance and software delivery. The right tool helps teams validate performance expectations, compare releases, and make informed decisions about scalability.
What Are Performance Testing Tools?
Performance testing tools simulate workloads, collect system metrics, and help teams evaluate whether an application meets defined performance requirements. Depending on the test objective, they can measure response times, transaction rates, concurrent users, error rates, and resource consumption.
Common types of performance testing include:
- Load testing: Measures behavior under expected and peak workloads.
- Stress testing: Pushes a system beyond its expected capacity to discover its limits.
- Spike testing: Evaluates sudden increases or decreases in traffic.
- Endurance testing: Checks stability during sustained workloads.
- Scalability testing: Examines how performance changes as resources or workload increase.
- Volume testing: Evaluates how systems behave when handling large amounts of data.
Popular Performance Testing Tools
1. Apache JMeter
Apache JMeter is an open-source tool used to test web applications, APIs, and supported network services. It offers configurable test plans, assertions, plugins, and reporting features.
Best for: Teams seeking a flexible, open-source testing solution.
2. Grafana k6
Grafana k6 is a developer-focused tool that uses JavaScript to define performance tests. It supports automated testing workflows and integrates with monitoring and visualization systems.
Best for: Engineering teams incorporating performance checks into CI/CD pipelines.
3. LoadRunner
OpenText LoadRunner supports enterprise performance testing across a range of application protocols and environments. It provides capabilities for simulating virtual users and analyzing test results.
Best for: Large organizations with complex applications and established performance-testing programs.
4. Gatling
Gatling supports code-based performance testing and detailed reports. Its approach helps teams maintain test scenarios in version control and automate repeated executions.
Best for: Developers who prefer maintainable, code-driven performance tests.
5. Locust
Locust is an open-source framework in which test scenarios are written in Python. It lets teams model user behavior and customize workload patterns.
Best for: Teams that need flexible scenarios and are comfortable with Python.
6. NeoLoad
NeoLoad is a performance testing platform designed for web applications, APIs, and enterprise environments. It supports reusable test design and performance analysis.
Best for: Organizations that require coordinated testing across complex systems.
7. BlazeMeter
BlazeMeter provides performance testing, test execution, and reporting capabilities for development and QA teams. It can help teams manage tests and integrate performance checks into delivery workflows.
Best for: Teams looking for centralized performance-testing workflows.
Key Features to Consider
When evaluating tools, compare the capabilities that matter most to your application and team.
- Workload modeling: Ability to simulate realistic user journeys and traffic patterns.
- Protocol support: Compatibility with your web applications, APIs, authentication, and services.
- Metrics and reporting: Visibility into average response time, percentiles, throughput, and errors.
- Scalability: Ability to generate the traffic required for meaningful tests.
- Automation: Support for scheduled execution and CI/CD integration.
- Monitoring: Integration with infrastructure, application, and database monitoring.
- Ease of use: Learning curve, scripting requirements, and test maintenance.
- Cost: Licensing, infrastructure, support, and ongoing operational expenses.
Performance Testing Tools Comparison
| Tool | Main strength | Suitable use |
|---|---|---|
| Apache JMeter | Flexible open-source testing | Web and API performance tests |
| Grafana k6 | Developer-focused automation | CI/CD and API testing |
| LoadRunner | Broad enterprise capabilities | Complex enterprise systems |
| Gatling | Code-based test scenarios | Repeatable automated testing |
| Locust | Python-based customization | Custom user-behavior models |
| NeoLoad | Enterprise test management | Large application environments |
| BlazeMeter | Managed workflows and reporting | Collaborative performance testing |
Features and licensing can vary by edition, deployment model, and product version. Verify current capabilities against your requirements before choosing a platform.
How to Choose the Right Tool
Begin by identifying the application under test and the performance goals you need to validate. Define acceptable response times, target throughput, expected concurrent users, and important business transactions.
Then evaluate your team’s technical expertise. A scripting-oriented open-source tool may be ideal for a team with programming and infrastructure experience. A commercial platform may be a better fit when you need enterprise support, centralized reporting, specialized protocol coverage, or managed collaboration.
Run a proof of concept using realistic test scenarios. Confirm that the tool can generate sufficient traffic, provide useful diagnostic information, and integrate with your existing development and monitoring processes.
Best Practices for Performance Testing
- Establish a baseline before major application or infrastructure changes.
- Use realistic workloads, test data, and user journeys.
- Test normal, peak, and unexpected traffic patterns.
- Monitor application servers, databases, networks, and test generators.
- Define measurable pass/fail criteria before running tests.
- Repeat tests after significant changes and compare results over time.
- Record test configurations and findings so results can be reproduced.
- Coordinate testing carefully to avoid disrupting production services.
Performance testing is most useful when it is repeatable and tied to clear service-level objectives rather than a single pass/fail result.
Common Challenges
Unrealistic workloads can produce misleading results. Inadequate monitoring may make it difficult to identify whether a bottleneck is caused by the application, database, network, or test infrastructure. Shared environments and inconsistent test data can also affect measurements.
To reduce these problems, validate the workload model, check the capacity of load generators, monitor the full application stack, and repeat tests under comparable conditions. Performance results should be interpreted in the context of the test environment and configuration.
Conclusion
Performance testing tools help teams measure application responsiveness, identify bottlenecks, and assess stability and scalability. Apache JMeter, Grafana k6, LoadRunner, Gatling, Locust, NeoLoad, and BlazeMeter each offer different approaches to performance testing.
The best choice depends on the application’s architecture, testing objectives, team skills, automation needs, and budget. Combined with realistic workloads, reliable monitoring, and repeatable test practices, the right tool can help teams deliver more dependable software.
