Upgrade & Secure Your Future with DevOps, SRE, DevSecOps, MLOps!
We spend hours scrolling social media and waste money on things we forget, but won’t spend 30 minutes a day earning certifications that can change our lives.
Master in DevOps, SRE, DevSecOps & MLOps by DevOps School!
Learn from Guru Rajesh Kumar and double your salary in just one year.
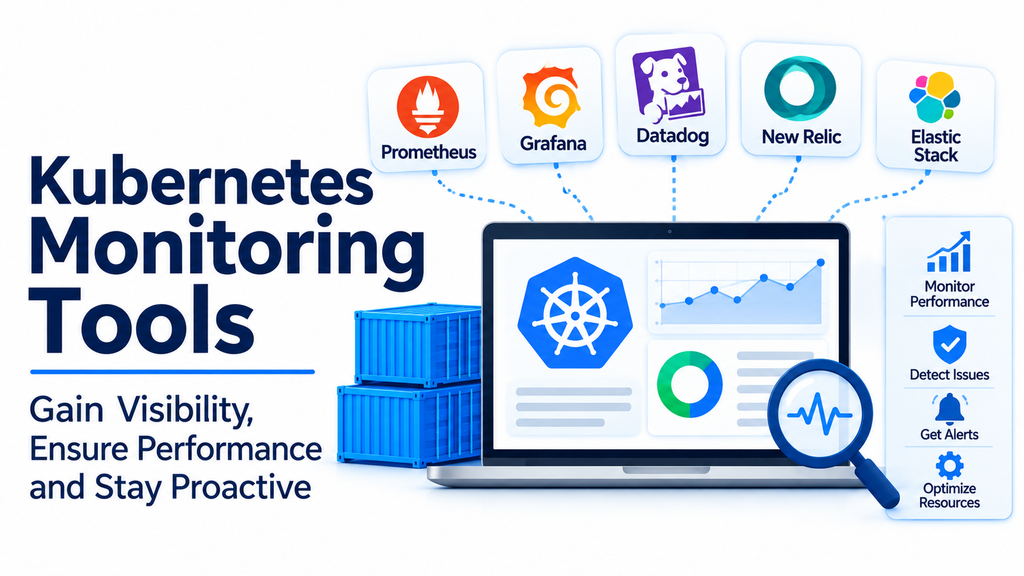
Kubernetes has become a leading platform for managing containerized applications and modern cloud-native infrastructure. It helps organizations deploy, scale, and operate applications across distributed environments. However, maintaining the performance and reliability of Kubernetes clusters requires continuous monitoring.
Kubernetes monitoring tools help administrators and DevOps teams understand cluster health, track application performance, identify resource consumption, and detect operational problems. They provide insights into nodes, Pods, containers, workloads, and application services.
With the right monitoring solution, organizations can identify potential issues before they affect users, improve infrastructure efficiency, and maintain reliable application operations.
What Are Kubernetes Monitoring Tools?
Kubernetes monitoring tools are software platforms and utilities that collect, analyze, and display operational data from Kubernetes clusters and their workloads.
They help teams understand how applications and infrastructure are performing by tracking metrics, logs, events, and other operational information.
Common capabilities include:
- Cluster monitoring: Track the health and availability of Kubernetes clusters.
- Node monitoring: Monitor CPU, memory, storage, and network usage across nodes.
- Pod monitoring: Identify unhealthy Pods, restarts, and resource consumption.
- Application monitoring: Measure application performance and service availability.
- Log management: Collect and analyze logs from containers and infrastructure components.
- Alerting: Notify administrators about failures, unusual activity, and resource constraints.
- Visualization: Display performance metrics through dashboards and charts.
- Capacity planning: Help teams understand resource requirements and optimize infrastructure usage.
Popular Kubernetes Monitoring Tools
1. Prometheus
Prometheus is an open-source monitoring and alerting toolkit widely used in Kubernetes environments. It collects time-series metrics from applications, infrastructure components, and cluster resources.
It is commonly used with Grafana to create monitoring dashboards.
Key capabilities:
- Time-series metrics collection.
- Flexible querying through PromQL.
- Alerting through Alertmanager.
- Service discovery for dynamic environments.
- Integration with Kubernetes exporters and applications.
Best suited for: DevOps and platform engineering teams that need flexible, open-source metrics monitoring.
2. Grafana
Grafana is an open-source analytics and visualization platform used to create dashboards from monitoring data. It connects to data sources such as Prometheus, Loki, and other observability systems.
It helps teams visualize Kubernetes performance and identify operational trends.
Key capabilities:
- Customizable monitoring dashboards.
- Visualization of cluster and application metrics.
- Alerting and notification integrations.
- Support for multiple data sources.
- Dashboard sharing and collaboration.
Best suited for: Teams that need customizable dashboards and centralized visualization of Kubernetes monitoring data.
3. Datadog
Datadog is a cloud-based monitoring and observability platform that provides infrastructure monitoring, application performance monitoring, and log management.
Its Kubernetes integrations help organizations monitor containerized workloads and understand application performance across distributed environments.
Key capabilities:
- Kubernetes cluster and node monitoring.
- Container resource tracking.
- Application performance monitoring.
- Log collection and analysis.
- Alerts and infrastructure dashboards.
Best suited for: Organizations that want an integrated commercial observability platform for cloud-native infrastructure.
4. New Relic
New Relic is an observability platform that provides infrastructure monitoring, application performance monitoring, and log analytics.
Its Kubernetes monitoring capabilities help teams understand how clusters, containers, and applications perform.
Key capabilities:
- Kubernetes cluster monitoring.
- Infrastructure performance tracking.
- Application performance monitoring.
- Distributed tracing.
- Alerts and dashboards.
Best suited for: Development and operations teams that need application and infrastructure observability in one platform.
5. Elastic Observability
Elastic Observability is part of the Elastic Stack ecosystem. It combines logs, metrics, and traces to provide visibility into application and infrastructure operations.
It can be used to monitor Kubernetes environments and investigate operational issues.
Key capabilities:
- Centralized log collection and analysis.
- Infrastructure metrics monitoring.
- Application performance insights.
- Search and visualization capabilities.
- Alerting and anomaly detection features.
Best suited for: Organizations that need powerful search, log analytics, and centralized observability.
6. Dynatrace
Dynatrace is an observability and application security platform that provides automated monitoring across applications, infrastructure, and cloud environments.
Its Kubernetes capabilities help teams analyze cluster performance and identify dependencies between services.
Key capabilities:
- Kubernetes and container monitoring.
- Automated topology and dependency mapping.
- Application performance monitoring.
- Distributed tracing.
- AI-assisted problem detection and analysis.
Best suited for: Enterprises managing complex cloud-native environments that need automated observability and root-cause analysis.
7. Splunk Observability Cloud
Splunk Observability Cloud provides monitoring and observability capabilities for applications and infrastructure. It helps organizations collect metrics, traces, and other operational data from distributed systems.
Key capabilities:
- Infrastructure monitoring.
- Kubernetes and container visibility.
- Distributed tracing.
- Real-time alerting.
- Performance dashboards and analytics.
Best suited for: Organizations that need comprehensive monitoring and troubleshooting across complex application environments.
8. Zabbix
Zabbix is an open-source monitoring platform used to monitor servers, networks, applications, and infrastructure. It can also be integrated into Kubernetes monitoring environments through suitable templates, exporters, and integrations.
Key capabilities:
- Infrastructure and server monitoring.
- Performance metrics collection.
- Configurable alerts and notifications.
- Dashboard and reporting features.
- Integration with external monitoring systems.
Best suited for: IT teams that want an open-source infrastructure monitoring platform with Kubernetes integration options.
Kubernetes Monitoring Tools Comparison
| Tool | Main strength | Best suited for |
|---|---|---|
| Prometheus | Metrics collection and alerting | Kubernetes and DevOps teams |
| Grafana | Dashboard visualization | Monitoring and platform teams |
| Datadog | Integrated observability | Cloud-native enterprises |
| New Relic | Application and infrastructure monitoring | Development teams |
| Elastic Observability | Log and data analysis | Infrastructure and security teams |
| Dynatrace | Automated observability | Large enterprises |
| Splunk Observability Cloud | Metrics and distributed tracing | Complex IT environments |
| Zabbix | Infrastructure monitoring | IT operations teams |
These platforms offer different monitoring approaches. Some focus on metrics collection, while others provide broader observability through logs, traces, dashboards, and automated analysis.
Important Features to Look For
Choosing a Kubernetes monitoring solution requires evaluating its ability to provide accurate and useful operational insights.
1. Real-Time Metrics Collection
The platform should collect important metrics from nodes, containers, Pods, and applications. This helps teams understand resource usage and identify performance problems.
2. Cluster Health Monitoring
Administrators should be able to identify unavailable nodes, unhealthy workloads, failed deployments, and application interruptions.
3. Log Management
Centralized logging makes it easier to investigate application errors, container failures, and infrastructure problems.
4. Alerting and Notifications
Configurable alerts can notify teams when performance thresholds are exceeded or when critical components become unhealthy.
5. Dashboard Customization
Custom dashboards allow teams to focus on important metrics for specific applications, clusters, and business services.
6. Distributed Tracing
For microservices environments, distributed tracing helps teams understand how requests move between services and identify performance bottlenecks.
7. Scalability
The monitoring platform should handle growing numbers of clusters, workloads, metrics, and applications without becoming difficult to operate.
8. Integration Capabilities
Compatibility with Kubernetes, cloud platforms, CI/CD systems, logging services, and incident management tools can improve operational workflows.
Business Applications of Kubernetes Monitoring Tools
Kubernetes monitoring supports organizations across several industries and technology environments.
- E-commerce: Monitor application availability and performance during high-traffic periods.
- Financial services: Track critical application infrastructure and identify operational disruptions.
- Healthcare technology: Monitor the reliability of cloud-based applications and services.
- SaaS platforms: Maintain visibility into application performance and resource utilization.
- Enterprise IT: Monitor cluster health across business-critical environments.
- DevOps operations: Detect deployment problems and investigate application failures.
- Cloud infrastructure: Optimize infrastructure resources across distributed Kubernetes environments.
Kubernetes Monitoring vs. Kubernetes Observability
Monitoring and observability are related concepts, but they have different purposes.
Kubernetes monitoring focuses on collecting and tracking predefined metrics, such as CPU usage, memory consumption, node availability, and Pod status.
Observability provides a broader understanding of system behavior by combining metrics, logs, traces, and contextual information. It helps teams investigate unfamiliar problems and understand why an application is behaving unexpectedly.
For example, monitoring may indicate that an application is responding slowly. Observability tools can help identify whether the cause is a database query, network delay, or overloaded service.
Both approaches are important for maintaining reliable Kubernetes environments.
Common Kubernetes Monitoring Challenges
Organizations may encounter several difficulties when monitoring Kubernetes environments.
- High metric volume: Large clusters can generate significant amounts of monitoring data.
- Dynamic infrastructure: Pods and containers are frequently created, removed, and rescheduled.
- Complex dependencies: Microservices may depend on multiple internal and external services.
- Alert fatigue: Excessive or poorly configured alerts can overwhelm operational teams.
- Data retention costs: Storing large volumes of logs and metrics can increase expenses.
- Limited visibility: Incomplete instrumentation can make it difficult to identify performance issues.
- Configuration complexity: Setting up monitoring across multiple clusters requires careful planning.
Organizations can reduce these challenges by defining meaningful metrics, configuring useful alerts, standardizing monitoring practices, and managing data retention appropriately.
How to Choose the Right Kubernetes Monitoring Tool
Before selecting a monitoring platform, consider these factors:
- Define monitoring requirements: Decide whether you need metrics, logs, traces, infrastructure monitoring, or complete observability.
- Evaluate cluster compatibility: Check support for your Kubernetes distributions and cloud environments.
- Review dashboard capabilities: Ensure the platform provides useful visualizations and customizable dashboards.
- Assess alerting features: Evaluate notification options, alert conditions, and incident integrations.
- Consider scalability: Confirm that the solution can handle future workload and cluster growth.
- Check integrations: Review compatibility with Prometheus, Grafana, logging platforms, and existing IT tools.
- Compare costs: Consider licensing, data ingestion, storage, retention, and operational expenses.
- Test with real workloads: Run a trial using representative applications to evaluate performance and usability.
Conclusion
Kubernetes monitoring tools are essential for maintaining the performance, availability, and reliability of containerized applications. They help organizations understand cluster health, track resource utilization, detect failures, and investigate application issues.
Prometheus and Grafana provide popular open-source monitoring and visualization capabilities, while Datadog, New Relic, Dynatrace, Splunk Observability Cloud, and Elastic Observability offer broader commercial observability features. Zabbix provides another option for infrastructure monitoring with suitable integrations.
The right solution depends on application complexity, infrastructure size, operational requirements, and budget. By implementing effective monitoring and alerting practices, organizations can improve troubleshooting, optimize resources, and maintain dependable Kubernetes environments.
