Upgrade & Secure Your Future with DevOps, SRE, DevSecOps, MLOps!
We spend hours scrolling social media and waste money on things we forget, but won’t spend 30 minutes a day earning certifications that can change our lives.
Master in DevOps, SRE, DevSecOps & MLOps by DevOps School!
Learn from Guru Rajesh Kumar and double your salary in just one year.
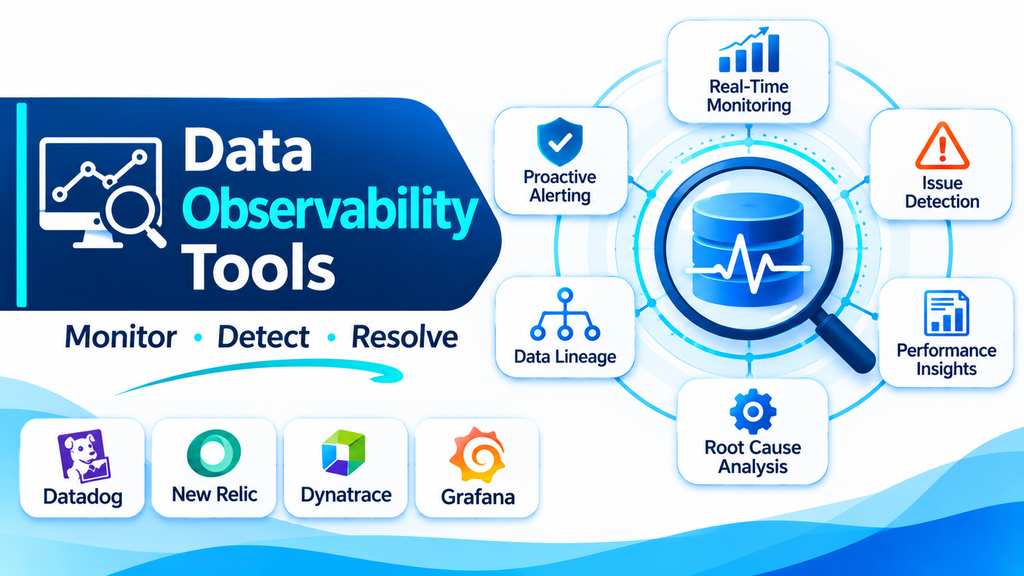
Modern organizations depend on accurate, reliable, and timely data to operate applications, generate reports, train AI models, and make business decisions. But as data environments grow across cloud platforms, warehouses, pipelines, and applications, detecting data problems becomes increasingly challenging.
A pipeline may run successfully while delivering incomplete records. A dashboard may display outdated information without showing an obvious error. A data source may change its structure and silently disrupt downstream reports. These problems can affect business decisions, customer experiences, and operational performance.
Data observability tools help organizations monitor the health of their data systems and identify issues before they create wider consequences. They provide visibility into data quality, freshness, volume, schema changes, distribution patterns, and pipeline performance.
What Are Data Observability Tools?
Data observability tools are software platforms that monitor, analyze, and troubleshoot the reliability of data across its lifecycle. They help data teams understand whether information is accurate, complete, fresh, consistent, and flowing as expected.
These tools collect information from data pipelines, databases, warehouses, transformation systems, and other parts of the data infrastructure. They analyze this information to detect unusual behavior, identify potential incidents, and notify responsible teams.
Unlike traditional infrastructure monitoring, which focuses primarily on servers, networks, and application performance, data observability focuses on the condition and reliability of the data itself.
Why Are Data Observability Tools Important?
Data problems are not always immediately visible. A pipeline can complete without errors while producing incorrect or incomplete results. Without effective monitoring, teams may discover these issues only after reports, applications, or business processes have been affected.
Data observability tools help organizations:
- Detect data quality issues: Identify missing values, duplicates, unexpected patterns, and inconsistent records.
- Monitor data freshness: Check whether datasets are updated within expected timeframes.
- Identify schema changes: Detect unexpected changes to columns, data types, and structures.
- Track data volume: Recognize unusual increases or decreases in records.
- Reduce downtime: Alert teams when data pipelines or datasets behave unexpectedly.
- Improve troubleshooting: Help engineers investigate the source and impact of data incidents.
- Build trust in analytics: Give business users greater confidence in reports, dashboards, and datasets.
Key Features of Data Observability Tools
1. Data Freshness Monitoring
Freshness monitoring checks whether data is arriving and updating according to expected schedules. It helps identify delayed pipelines, missing updates, and stale datasets.
2. Data Quality Monitoring
These capabilities evaluate data against defined rules and expected conditions. Teams can monitor completeness, validity, uniqueness, consistency, and other quality indicators.
3. Schema Change Detection
Schema monitoring identifies changes to data structures, such as added or removed columns, renamed fields, and modified data types. This helps prevent unexpected changes from disrupting downstream systems.
4. Volume Monitoring
Volume monitoring tracks the number of records or the amount of data processed over time. Unusual variations can indicate ingestion failures, duplicate records, or unexpected source-system activity.
5. Anomaly Detection
Some platforms use statistical techniques and machine learning to identify patterns that differ from normal data behavior. This can help teams detect issues without creating a separate manual rule for every possible problem.
6. Data Lineage and Impact Analysis
Lineage capabilities help teams understand how data moves between systems and which downstream tables, reports, or applications may be affected by an incident.
7. Alerting and Incident Management
Observability platforms can notify teams when monitored conditions exceed defined thresholds or unusual patterns are detected. Integrations with incident management and collaboration systems help coordinate investigation and resolution.
8. Root Cause Analysis
Some tools provide investigation features that help trace data incidents to upstream sources, transformations, or pipeline changes, reducing the time required to identify the underlying problem.
Popular Data Observability Tools
Organizations can choose from several platforms depending on their data architecture, monitoring requirements, and preferred workflows.
- Monte Carlo: Provides data observability capabilities for monitoring data quality, freshness, volume, schema changes, and data incidents.
- Bigeye: Focuses on data observability, automated monitoring, anomaly detection, and data quality management.
- Acceldata: Offers data observability and data reliability capabilities across data pipelines and infrastructure.
- Anomalo: Uses machine learning to monitor data quality and detect unusual patterns in datasets.
- Soda: Provides data quality testing, monitoring, and observability capabilities for data pipelines and platforms.
- Databand: Provides data pipeline observability, helping teams monitor pipeline execution, detect failures, and investigate data issues.
- Metaplane: Offers data observability and monitoring capabilities for modern data warehouses and analytics environments.
- WhyLabs: Provides monitoring and observability capabilities for data and machine learning systems, including data drift and distribution monitoring.
- Elementary: Provides data observability capabilities closely integrated with dbt workflows, including data tests, anomaly detection, and monitoring.
- OpenLineage: An open standard for collecting and sharing lineage metadata, which can support broader observability architectures when integrated with compatible tools.
The capabilities and integration options vary by product, deployment model, and edition. Organizations should evaluate each platform against their own technical requirements.
How Data Observability Tools Work
Data observability platforms generally connect to data sources, warehouses, transformation systems, and pipeline orchestration tools.
After integration, they collect metadata and monitoring signals such as record counts, update timestamps, schema information, pipeline execution details, and data quality measurements.
The platform establishes expected behavior through configured rules, historical patterns, or automated analysis. It then continuously or periodically evaluates incoming information against those expectations.
When it identifies an unusual condition, it can generate an alert and provide supporting context to help engineers investigate. Depending on the platform, teams may also be able to trace the affected data through lineage information and identify downstream dependencies.
This process helps data teams move from reactive troubleshooting toward proactive data reliability management.
Benefits Across Different Industries
Banking and Financial Services: Financial organizations use data observability to monitor reporting datasets, transaction information, risk analytics, and data pipelines that support business operations.
Healthcare: Healthcare organizations can monitor the freshness and quality of clinical, administrative, and operational datasets while supporting reliable analytics workflows.
Retail and E-commerce: Retailers use observability to identify issues in product catalogs, inventory feeds, customer data, order information, and sales reporting.
Manufacturing: Manufacturers can monitor production data, equipment information, supply chain records, and operational analytics pipelines.
Telecommunications: Telecom companies can use observability to monitor network data, customer records, billing information, and large-scale data ingestion processes.
Technology and SaaS: Software companies can monitor analytics pipelines, product usage data, customer reporting, and datasets used by AI-powered features.
Common Challenges in Data Observability
Although observability tools provide valuable capabilities, implementation can introduce challenges.
- Complex integrations: Connecting multiple databases, warehouses, pipelines, and cloud services can require significant setup.
- Alert fatigue: Excessive or poorly configured notifications can make it difficult for teams to identify important incidents.
- Unclear ownership: Monitoring is less effective when no team or individual is responsible for responding to data issues.
- Monitoring costs: Large data environments may generate substantial monitoring activity and associated platform costs.
- Limited context: Alerts without lineage, documentation, or business context can make root cause analysis difficult.
- Changing data environments: New datasets, pipeline modifications, and evolving business requirements require continuous updates to monitoring practices.
Organizations can address these challenges by prioritizing critical datasets, assigning clear ownership, tuning alert thresholds, and integrating observability into existing data engineering workflows.
How to Choose the Right Data Observability Tool
Selecting a suitable platform requires evaluating both technical capabilities and organizational needs.
- Data infrastructure compatibility: Confirm that the platform supports the organization’s databases, warehouses, pipelines, and cloud environments.
- Monitoring coverage: Evaluate support for freshness, volume, schema, quality, and anomaly monitoring.
- Anomaly detection: Understand whether the tool provides automated detection, configurable rules, or both.
- Lineage capabilities: Check whether it can help identify upstream causes and downstream impact.
- Alerting integrations: Review support for collaboration, ticketing, and incident management workflows.
- Ease of implementation: Consider deployment complexity, configuration effort, and ongoing maintenance.
- Scalability: Ensure the platform can handle the organization’s data volumes and growing infrastructure.
- Pricing and total cost: Evaluate licensing, usage-based charges, implementation, and operational costs.
A practical approach is to begin with a small group of business-critical datasets, measure how effectively the platform detects incidents, and expand monitoring as the organization gains experience.
The Future of Data Observability
Data observability is evolving alongside cloud computing, real-time analytics, data products, and artificial intelligence.
More platforms are incorporating automated anomaly detection, intelligent root cause analysis, and deeper lineage information. These capabilities can help teams identify problems faster and understand how incidents affect business processes.
As organizations use more data to develop and operate AI systems, monitoring data quality, freshness, and distribution changes will become increasingly important. Data observability will also continue to overlap with data quality management, data governance, and data reliability engineering.
The broader direction is toward proactive monitoring, better automation, and a unified understanding of data health across complex environments.
Conclusion
Data observability tools help organizations maintain reliable data by monitoring freshness, quality, volume, schema changes, anomalies, and pipeline behavior. They provide data teams with the visibility needed to detect incidents, investigate root causes, and reduce the impact of unreliable information.
Choosing the right solution depends on the organization’s data architecture, monitoring priorities, integration requirements, and budget. When combined with clear ownership and effective incident management practices, data observability can strengthen trust in data and support dependable analytics and business operations.
