Upgrade & Secure Your Future with DevOps, SRE, DevSecOps, MLOps!
We spend hours scrolling social media and waste money on things we forget, but won’t spend 30 minutes a day earning certifications that can change our lives.
Master in DevOps, SRE, DevSecOps & MLOps by DevOps School!
Learn from Guru Rajesh Kumar and double your salary in just one year.
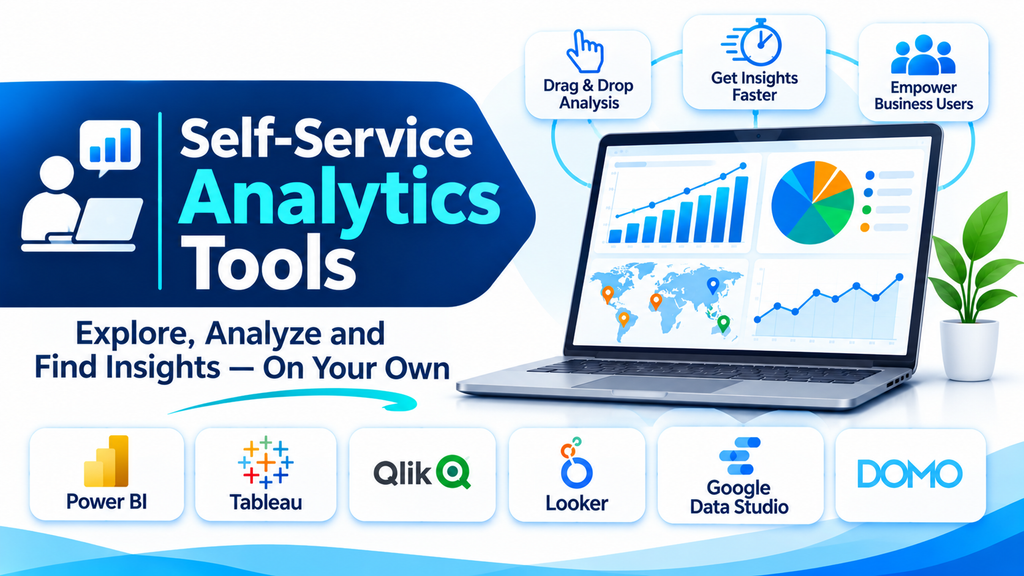
Businesses generate data across sales, marketing, finance, customer service, operations, and other departments. Traditionally, employees often had to depend on data analysts or IT teams to prepare reports and answer business questions. This could slow down decision-making and create reporting bottlenecks.
Self-service analytics tools address this challenge by allowing business users to explore data, create reports, build dashboards, and discover insights with less technical assistance. These platforms make analytics more accessible to employees while helping organizations develop a stronger data-driven culture.
What Are Self-Service Analytics Tools?
Self-service analytics tools are software platforms that enable users to access, analyze, and visualize business data independently, without requiring advanced programming or constant support from data specialists.
They typically provide user-friendly interfaces, drag-and-drop functionality, interactive dashboards, data connectors, and guided reporting features. Users can explore available datasets, apply filters, create charts, and share findings with colleagues.
These tools are designed for business users as well as analysts. They help make data exploration more accessible while allowing technical teams to maintain appropriate data governance and security.
Why Are Self-Service Analytics Tools Important?
When every reporting request must pass through a central analytics team, employees may experience delays in obtaining the information they need. Self-service analytics helps distribute analytical capabilities across departments.
Key benefits include:
- Faster decision-making: Employees can access relevant information and investigate business questions more quickly.
- Reduced reporting bottlenecks: Business teams can create many routine reports independently.
- Greater data accessibility: More employees can work with approved datasets and dashboards.
- Improved productivity: Analysts can spend less time handling repetitive reporting requests.
- Better business understanding: Teams can explore trends and performance indicators related to their responsibilities.
- Stronger collaboration: Employees can share reports and insights across departments.
- Data-driven culture: Wider access to analytics encourages decisions based on evidence.
Key Features of Self-Service Analytics Tools
1. User-Friendly Interface
An intuitive interface makes it easier for users without programming experience to navigate datasets, create reports, and explore information.
2. Drag-and-Drop Analytics
Drag-and-drop functionality allows users to build charts, dashboards, and reports by selecting and arranging data fields.
3. Data Connectivity
Self-service platforms connect to supported databases, spreadsheets, cloud applications, data warehouses, and other business systems.
4. Interactive Dashboards
Dashboards present key business metrics in a visual format. Users can apply filters, explore specific categories, and examine details.
5. Data Preparation
Some tools provide features for cleaning, combining, filtering, and transforming datasets before analysis.
6. Natural-Language Queries
Certain platforms allow users to ask questions about their data in everyday language and receive visual or analytical responses.
7. Reporting and Sharing
Users can publish dashboards, distribute reports, and collaborate with colleagues through supported sharing features.
8. Data Governance and Security
Permissions, certified datasets, access controls, and centralized administration help organizations provide self-service access without losing control of sensitive information.
9. AI-Assisted Insights
Some platforms provide automated explanations, suggested visualizations, anomaly detection, and other AI-supported analytical capabilities.
Popular Self-Service Analytics Tools
Organizations can choose from several platforms depending on their users, data environment, governance requirements, and analytics goals.
- Microsoft Power BI: Provides self-service reporting, interactive dashboards, data modeling, and integration with Microsoft services.
- Tableau: Supports visual data exploration, interactive dashboards, and self-service analytics for business users.
- Qlik Sense: Offers associative analytics, data discovery, interactive visualizations, and guided exploration.
- Looker: Provides governed analytics through reusable data models and self-service exploration.
- ThoughtSpot: Focuses on search-driven analytics and natural-language data exploration.
- Domo: Combines data integration, dashboards, reporting, and business analytics in a cloud-based platform.
- Sisense: Offers analytics and embedded BI capabilities that help organizations deliver data insights through applications and workflows.
- MicroStrategy: Provides enterprise analytics, reporting, dashboards, and governed data exploration.
- SAP Analytics Cloud: Combines business intelligence, planning, and analytics capabilities for organizations using SAP and other supported data sources.
- Zoho Analytics: Provides self-service reporting, data visualization, dashboards, and analytics for business teams.
The right platform depends on factors such as ease of use, supported data sources, licensing, governance capabilities, and the level of analytical flexibility required.
How Self-Service Analytics Tools Work
Self-service analytics platforms typically connect to approved data sources such as databases, spreadsheets, data warehouses, and business applications.
Once connected, the platform makes available datasets accessible through a visual interface. Depending on the product, data may be prepared in advance or transformed by users through built-in tools.
Users can select fields, apply filters, create calculations, and build visualizations. They can then arrange these visualizations into dashboards and reports to answer specific business questions.
Many platforms also provide sharing and collaboration capabilities. Administrators can manage permissions, define approved datasets, and establish governance policies to help ensure users work with reliable information.
Applications Across Different Industries
Banking and Financial Services: Finance teams use self-service analytics to explore transaction trends, monitor financial performance, and prepare business reports.
Healthcare: Healthcare administrators can analyze operational metrics, resource utilization, service activity, and other approved organizational datasets.
Retail and E-commerce: Retail teams can examine sales performance, inventory levels, customer behavior, and product trends without submitting every reporting request to IT.
Manufacturing: Operations teams can explore production output, quality measurements, supply chain information, and equipment performance.
Education: Institutions can analyze enrollment, attendance, academic results, and administrative performance through interactive reports.
Marketing: Marketing professionals can evaluate campaign performance, website engagement, lead generation, and conversion trends.
Telecommunications: Telecom teams can explore customer activity, service performance, revenue trends, and operational metrics.
Common Challenges in Self-Service Analytics
Although self-service analytics provides greater flexibility, organizations need to manage several challenges to ensure that independent data exploration remains reliable.
- Inconsistent metrics: Different users may calculate the same business indicator in different ways.
- Poor data quality: Incomplete or outdated datasets can produce misleading insights.
- Limited data literacy: Employees may need training to interpret visualizations and analytical results correctly.
- Security risks: Poorly managed permissions can expose confidential business or customer information.
- Uncontrolled data duplication: Users may create multiple versions of similar reports and datasets.
- Performance issues: Complex queries and large datasets can affect report responsiveness.
- Governance difficulties: Organizations must balance user independence with centralized standards and accountability.
A successful implementation combines accessible analytics with certified datasets, clear definitions, role-based access, and user education.
How to Choose the Right Self-Service Analytics Tool
Selecting a platform requires evaluating both business usability and technical requirements.
- Ease of use: Check whether employees can create reports and explore information without extensive technical training.
- Data connectivity: Confirm compatibility with the organization’s databases, spreadsheets, cloud applications, and warehouses.
- Visualization features: Review dashboard design, chart options, filtering, and interactive exploration.
- Data preparation: Evaluate built-in capabilities for cleaning, combining, and transforming information.
- Governance: Look for certified datasets, centralized metric definitions, access controls, and administrative features.
- Scalability: Ensure that the platform can support growing numbers of users and increasing data volumes.
- Collaboration: Assess report sharing, scheduled distribution, and team-based workflows.
- AI capabilities: Consider natural-language queries and automated insights where they support actual business needs.
- Total cost: Include licensing, implementation, training, infrastructure, and ongoing administration.
Organizations should test shortlisted platforms with real users and representative datasets before making a broader investment.
The Future of Self-Service Analytics Tools
Self-service analytics is evolving through artificial intelligence, natural-language interfaces, cloud data platforms, and automated data preparation.
AI-assisted features are making it easier for employees to ask questions, generate visualizations, and understand analytical results. Natural-language interactions may reduce the technical knowledge required to explore data, although users still need to validate the context and accuracy of generated insights.
Organizations are also placing greater emphasis on governed self-service analytics. This approach combines employee independence with trusted datasets, consistent business definitions, security controls, and responsible data access.
As analytics becomes more integrated into everyday business applications, self-service tools are likely to play an increasingly important role in helping employees use information as part of their regular workflows.
Conclusion
Self-service analytics tools make business data more accessible by allowing employees to explore information, create reports, and build dashboards with less dependence on technical teams. They can improve productivity, accelerate routine analysis, and support a stronger data-driven culture.
Successful adoption requires more than choosing an easy-to-use platform. Organizations also need reliable data, clear governance, appropriate security, and training that helps employees interpret results correctly. With these foundations in place, self-service analytics can make data more useful across the entire organization.
