Upgrade & Secure Your Future with DevOps, SRE, DevSecOps, MLOps!
We spend hours scrolling social media and waste money on things we forget, but won’t spend 30 minutes a day earning certifications that can change our lives.
Master in DevOps, SRE, DevSecOps & MLOps by DevOps School!
Learn from Guru Rajesh Kumar and double your salary in just one year.
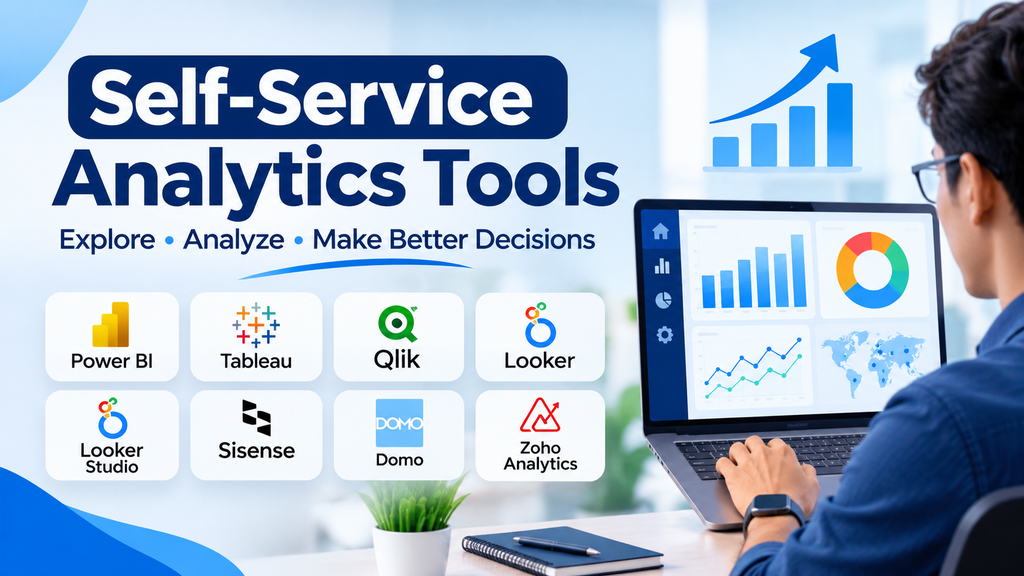
What Are Self-Service Analytics Tools?
Self-service analytics tools are software platforms that allow business users to access, explore, analyze, and visualize data without depending entirely on data analysts or IT teams. These tools provide user-friendly dashboards, interactive reports, drag-and-drop interfaces, and built-in analytical capabilities that help employees make informed decisions.
Organizations use self-service analytics to make data more accessible across departments, reduce reporting delays, and encourage data-driven decision-making.
Why Are Self-Service Analytics Tools Important?
Businesses generate large volumes of data from sales, marketing, finance, customer interactions, operations, and other activities. Traditional reporting processes can create bottlenecks when every department depends on technical teams for insights.
Self-service analytics helps organizations overcome these challenges by enabling employees to independently explore trusted business data.
Key benefits include:
- Faster decision-making through immediate access to business insights.
- Reduced dependency on IT and data analytics teams.
- Improved productivity through automated reports and dashboards.
- Better collaboration across departments.
- Greater visibility into business performance.
- More informed decisions through interactive data exploration.
- Reduced reporting workloads and operational delays.
Key Features of Self-Service Analytics Tools
Modern self-service analytics platforms offer several capabilities that make data analysis easier for non-technical users.
- Interactive Dashboards
Interactive dashboards present important business metrics through charts, graphs, tables, and visual indicators. Users can filter information and explore specific performance trends.
- Drag-and-Drop Analytics
Drag-and-drop interfaces allow users to build reports and visualizations without writing complex queries or programming code.
- Data Connectivity
These tools connect to databases, spreadsheets, cloud applications, data warehouses, and other business systems to bring information into a unified analytical environment.
- Data Visualization
Charts, graphs, maps, and other visual elements help users understand complex information and identify patterns more easily.
- Natural Language Queries
Some platforms allow users to ask questions in everyday language and receive relevant data insights, making analytics more accessible.
- Automated Reporting
Automated reporting features help users schedule reports, distribute dashboards, and monitor business performance regularly.
- Data Governance and Security
Access controls, permissions, data certifications, and governance policies help ensure that users work with appropriate and reliable information.
- Collaboration and Sharing
Users can share reports, dashboards, and analytical findings with colleagues to support collaboration and informed decision-making.
Popular Self-Service Analytics Tools
Several platforms provide self-service analytics capabilities for organizations of different sizes and industries.
- Microsoft Power BI
Power BI is a business intelligence platform that enables users to connect data sources, create interactive dashboards, and share reports. Its integration with Microsoft products makes it useful for organizations already working within the Microsoft ecosystem.
- Tableau
Tableau provides advanced data visualization and interactive analytics capabilities. It helps users explore complex datasets, create dashboards, and communicate insights through visual storytelling.
- Qlik Sense
Qlik Sense offers interactive analytics, data exploration, and visualization features. Its associative analytics approach helps users investigate relationships across different data points.
- Looker
Looker provides business intelligence and data exploration capabilities built around governed data models. It helps organizations create consistent metrics and distribute insights across teams.
- Looker Studio
Looker Studio enables users to create customizable reports and dashboards using connected data sources. It is commonly used for marketing reporting and business performance analysis.
- ThoughtSpot
ThoughtSpot focuses on search-driven analytics and AI-powered insights. Users can explore business data through natural language queries and interactive analytical experiences.
- Sisense
Sisense provides analytics and embedded business intelligence capabilities. Organizations can use it to build dashboards and integrate analytical experiences into applications and workflows.
- Domo
Domo combines data integration, visualization, dashboards, and business intelligence features. It helps organizations monitor performance and access business information through a centralized platform.
- Zoho Analytics
Zoho Analytics offers reporting, data visualization, and self-service business intelligence capabilities. It allows users to connect multiple data sources and create interactive reports.
- SAP Analytics Cloud
SAP Analytics Cloud combines business intelligence, planning, and predictive analytics capabilities. It supports organizations that want to analyze business performance and connect insights with planning activities.
How Do Self-Service Analytics Tools Work?
Self-service analytics platforms simplify the process of transforming raw data into meaningful business insights.
A typical workflow includes the following stages:
- Data Connection: Users connect databases, spreadsheets, cloud applications, and other data sources.
- Data Preparation: Information is cleaned, combined, organized, and prepared for analysis.
- Data Exploration: Users examine datasets, apply filters, and investigate business questions.
- Visualization: Charts, graphs, and dashboards present findings in an understandable format.
- Reporting: Users create reports and share relevant insights with teams.
- Decision-Making: Business departments use the findings to improve strategies and operations.
Industries That Use Self-Service Analytics Tools
Self-service analytics is valuable across industries where employees need timely access to business information.
- Retail: Analyze sales performance, customer behavior, inventory, and product trends.
- Healthcare: Monitor operational performance, resource utilization, and administrative data.
- Banking and Finance: Evaluate financial performance, transactions, and business risks.
- Manufacturing: Track production efficiency, quality metrics, and operational performance.
- Marketing: Measure campaign results, customer engagement, and conversion rates.
- Education: Monitor enrollment, student performance, and institutional operations.
- Telecommunications: Analyze customer usage, service performance, and customer retention.
Challenges of Self-Service Analytics
Although self-service analytics improves data accessibility, organizations must address several challenges to achieve reliable results.
- Data Quality Issues
Inaccurate, incomplete, or inconsistent information can produce misleading reports and incorrect conclusions.
- Lack of Data Literacy
Employees may struggle to interpret dashboards or select appropriate analytical methods without sufficient training.
- Data Governance Risks
Uncontrolled data access can expose confidential information or create inconsistent business definitions.
- Integration Complexity
Connecting multiple data sources can require additional preparation, technical configuration, and maintenance.
- Inconsistent Reporting
Different departments may calculate the same business metric differently, resulting in conflicting reports.
- Performance Limitations
Large datasets and complex queries can affect dashboard performance if the platform and underlying infrastructure are not properly configured.
Best Practices for Implementing Self-Service Analytics
Organizations can improve the effectiveness of self-service analytics by following practical implementation strategies.
- Establish clear data governance policies and access permissions.
- Maintain accurate, consistent, and well-documented datasets.
- Provide training to improve employee data literacy.
- Create reusable dashboards and standardized business metrics.
- Integrate reliable data sources and maintain data quality.
- Monitor platform usage, performance, and security.
- Encourage collaboration between business users and data teams.
- Start with high-value use cases before expanding across the organization.
How to Choose the Right Self-Service Analytics Tool
Selecting the right platform depends on an organization’s data environment, user requirements, and business objectives.
Consider these factors before making a decision:
- Ease of Use: Choose a platform with an intuitive interface that supports non-technical users.
- Data Connectivity: Check whether it integrates with the organization’s databases, cloud platforms, and business applications.
- Visualization Capabilities: Evaluate dashboard customization, reporting options, and interactive charts.
- Scalability: Ensure the platform can support growing data volumes and increasing numbers of users.
- Security: Review authentication, access controls, encryption, and governance capabilities.
- Integration: Consider compatibility with existing business intelligence and data management systems.
- Pricing: Compare licensing models, implementation costs, and ongoing maintenance expenses.
- Support and Training: Evaluate documentation, technical support, and available learning resources.
The Future of Self-Service Analytics
Self-service analytics continues to evolve as organizations adopt artificial intelligence, cloud computing, and modern data platforms.
AI-powered analytics is making it easier for users to ask questions, identify patterns, and generate insights. Natural language interfaces are reducing the technical knowledge required to explore data.
Automated insights and predictive analytics are also helping organizations identify potential opportunities and risks. Meanwhile, stronger governance capabilities are supporting secure and consistent data access across departments.
As these technologies mature, self-service analytics is expected to become an increasingly important part of everyday business operations.
Conclusion
Self-service analytics tools empower business users to explore data, create reports, and make informed decisions without relying entirely on specialized technical teams. With features such as interactive dashboards, data visualization, natural language queries, and automated reporting, these platforms help organizations improve productivity and accelerate access to insights.
Choosing the right solution requires evaluating usability, data integration, governance, scalability, security, and cost. When supported by reliable data and effective governance practices, self-service analytics can help build a more collaborative and data-driven organization.
