Upgrade & Secure Your Future with DevOps, SRE, DevSecOps, MLOps!
We spend hours scrolling social media and waste money on things we forget, but won’t spend 30 minutes a day earning certifications that can change our lives.
Master in DevOps, SRE, DevSecOps & MLOps by DevOps School!
Learn from Guru Rajesh Kumar and double your salary in just one year.
Introduction
Observability platforms are specialized tools that allow organizations to monitor, trace, and analyze the health and performance of complex systems, applications, and infrastructure. In simple terms, these platforms help teams understand what is happening inside their systems by collecting metrics, logs, and traces and providing actionable insights.
Modern businesses increasingly rely on distributed architectures, microservices, cloud-native deployments, and hybrid systems. Observability platforms matter because they provide the visibility needed to maintain performance, prevent downtime, and quickly resolve incidents before they impact end-users.
Common real-world use cases include:
- Monitoring cloud-native applications and containerized workloads
- Tracing distributed microservices to identify latency and bottlenecks
- Detecting anomalies and performance regressions in real time
- Correlating logs, metrics, and traces for root-cause analysis
- Supporting incident response and SRE workflows
Buyers should evaluate:
- Metrics, logs, and trace collection capabilities
- Real-time alerting and anomaly detection
- Distributed tracing support
- Dashboards and visualization features
- AI/ML-driven insights
- Integrations with cloud, CI/CD, and DevOps tools
- Scalability and data retention
- Security and compliance
- Ease of deployment and maintenance
- Cost structure
Best for: DevOps engineers, SREs, platform teams, cloud architects, IT operations, and enterprises managing complex distributed systems.
Not ideal for: very small systems or single-server applications where simple monitoring scripts are sufficient, or teams that do not require advanced correlation and distributed tracing.
Key Trends in Observability Platforms
AI-driven anomaly detection is increasingly embedded to automatically surface performance and operational issues.
- End-to-end distributed tracing is essential for microservices, serverless architectures, and hybrid cloud environments.
- Cloud-native observability adoption continues to rise with Kubernetes and containerized workloads.
- Unified data model platforms that integrate logs, metrics, and traces are preferred for faster troubleshooting.
- Predictive monitoring using machine learning to anticipate failures before they happen.
- OpenTelemetry standard adoption ensures interoperability across observability tools.
- Automated remediation workflows are increasingly integrated with alerting to reduce manual incident resolution.
- Enhanced security and compliance features to support SOC 2, ISO 27001, GDPR, and HIPAA requirements.
- Scalable SaaS and hybrid deployments to handle high data volumes and distributed environments.
- Integrated analytics and dashboards with real-time insights for engineering and business teams.
How We Selected These Tools
The top observability platforms were chosen using the following criteria:
- Market adoption and enterprise mindshare
- Depth and completeness of features
- Reliability, uptime, and performance signals
- Security posture and compliance capabilities
- Integration support with cloud, CI/CD, and DevOps workflows
- Developer experience and ease of adoption
- Scalability for high-volume distributed systems
- Support for distributed tracing, logs, and metrics
- Reporting, dashboards, and visualization quality
- Customer fit across SMB, mid-market, and enterprise segments
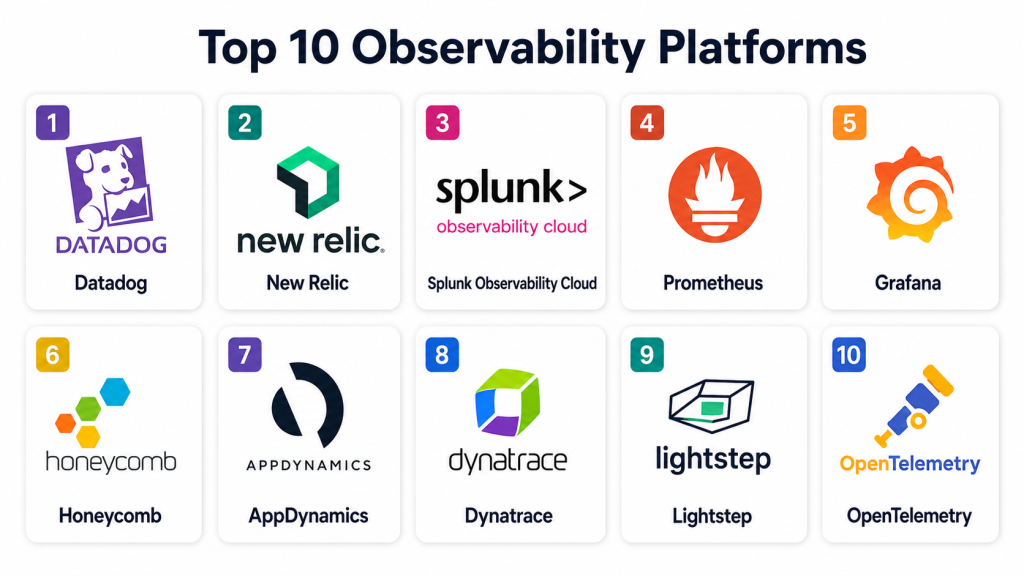
Top 10 Observability Platforms
#1 — Datadog
Short description: Datadog provides a unified observability platform for metrics, logs, and traces, helping teams monitor applications, cloud infrastructure, and services in real time.
Key Features
- Unified metrics, logs, and traces
- Real-time dashboards and alerting
- AI-based anomaly detection
- Distributed tracing support
- Cloud-native integrations
- Log analytics and aggregation
- API and automation capabilities
Pros
- Strong ecosystem and integration options
- Excellent for cloud-native and containerized workloads
- AI-driven insights for faster incident detection
Cons
- Cost can increase significantly with large data volumes
- Complex setup for on-premises environments
- May require training for full feature adoption
Platforms / Deployment
Web / Linux / Windows / macOS
Cloud / Hybrid
Security & Compliance
Supports SSO, RBAC, MFA, audit logs, encryption, and compliance standards like SOC 2, ISO 27001, and GDPR.
Integrations & Ecosystem
Datadog integrates with a wide range of tools:
- AWS, Azure, GCP
- Kubernetes and Docker
- CI/CD pipelines
- Slack, Jira, ServiceNow
- Terraform, Ansible
- API access for automation
Support & Community
Extensive documentation, enterprise support plans, community forums, and knowledge base available.
#2 — New Relic
Short description: New Relic is a full-stack observability platform designed to monitor applications, infrastructure, and digital experiences with real-time insights.
Key Features
- Application performance monitoring (APM)
- Infrastructure monitoring
- Distributed tracing
- Logs and metrics correlation
- Dashboards and alerting
- AI-assisted anomaly detection
- Real-time analytics
Pros
- Unified observability experience
- AI-powered insights for proactive monitoring
- Strong SaaS-based approach
Cons
- Pricing can become complex for large-scale deployments
- Steeper learning curve for advanced features
- Some integrations require additional configuration
Platforms / Deployment
Web / Linux / Windows / macOS
Cloud / Hybrid
Security & Compliance
SSO, RBAC, encryption, audit logs; SOC 2 and ISO 27001 compliance available.
Integrations & Ecosystem
Integrates with cloud providers, DevOps, alerting, and collaboration tools:
- AWS, Azure, GCP
- Kubernetes, Docker
- Jenkins, GitHub Actions
- PagerDuty, Slack
- Terraform, Ansible
- Custom API integrations
Support & Community
Offers enterprise support, onboarding resources, detailed documentation, and active community engagement.
#3 — Splunk Observability Cloud
Short description: Splunk Observability Cloud combines monitoring, tracing, and log analysis to provide end-to-end visibility across applications and infrastructure.
Key Features
- Real-time metrics monitoring
- Log aggregation and analysis
- Distributed tracing
- AI/ML-based anomaly detection
- Automated alerting
- Dashboards and visualization
- API-driven workflows
Pros
- Scalable for large enterprise environments
- Strong analytics and visualization capabilities
- Integrates with multiple cloud and on-prem systems
Cons
- Cost can be high for massive deployments
- Onboarding may require technical expertise
- Some advanced features require additional modules
Platforms / Deployment
Web / Linux / Windows / macOS
Cloud / Hybrid
Security & Compliance
Supports SSO, MFA, encryption, audit logs, and enterprise compliance standards.
Integrations & Ecosystem
- AWS, Azure, GCP
- Kubernetes, Docker
- CI/CD tools
- ITSM and alerting platforms
- REST APIs
- Security monitoring solutions
Support & Community
Enterprise support, professional services, extensive documentation, and active user community.
#4 — Prometheus
Short description: Prometheus is an open-source monitoring and alerting toolkit focused on metrics collection and time-series analysis, ideal for cloud-native environments.
Key Features
- Time-series metrics collection
- Multi-dimensional data model
- Powerful query language
- Alerting and notifications
- Kubernetes-native integrations
- Grafana dashboards support
- Service discovery and exporter-based data collection
Pros
- Open-source and free to use
- Strong for cloud-native environments
- Flexible and extensible
Cons
- Requires self-hosting and maintenance
- Limited log and tracing capabilities without extensions
- Scaling large environments may require additional architecture
Platforms / Deployment
Linux / macOS
Self-hosted / Cloud via managed solutions
Security & Compliance
Depends on deployment configuration. RBAC and authentication can be implemented, but formal certifications are not part of Prometheus itself.
Integrations & Ecosystem
- Kubernetes, Docker
- Grafana
- Alertmanager
- Cloud provider exporters
- CI/CD pipelines
- APIs for custom integrations
Support & Community
Active open-source community, documentation, and community forums.
#5 — Grafana
Short description: Grafana provides visualization and analytics for time-series data, often used alongside Prometheus, Loki, and other observability backends to create dashboards and alerts.
Key Features
- Customizable dashboards
- Alerting and notifications
- Data source integrations
- Logs and metrics visualization
- Plugin ecosystem
- Query builder for multiple backends
- Collaboration features
Pros
- Excellent visualization and alerting
- Open-source and extensible
- Can unify multiple observability data sources
Cons
- Primarily visualization-focused; requires data sources
- Advanced features may need plugins
- Alerting can be complex to configure for large environments
Platforms / Deployment
Web / Linux / Windows / macOS
Cloud / Self-hosted / Hybrid
Security & Compliance
Supports SSO, RBAC, MFA, audit logs. Compliance depends on deployment and backend data sources.
Integrations & Ecosystem
- Prometheus, Loki, Tempo
- Cloud providers
- CI/CD tools
- Collaboration and incident management tools
- APIs for custom dashboards
Support & Community
Extensive documentation, active open-source community, enterprise support options available.
#6 — Honeycomb
Short description: Honeycomb is a developer-centric observability platform designed for high-cardinality data and tracing across distributed systems.
Key Features
- Distributed tracing
- High-cardinality event analysis
- Real-time dashboards
- Query-driven exploration
- Alerting and notifications
- API and SDK integrations
- Event correlation across services
Pros
- Excellent for debugging and exploratory analysis
- Developer-focused workflow
- Supports complex distributed systems
Cons
- Requires data instrumentation
- Pricing can scale with event volume
- Learning curve for new users
Platforms / Deployment
Web / Cloud
Cloud-managed
Security & Compliance
Supports RBAC, SSO, encryption, and audit logging. Specific certifications vary by plan.
Integrations & Ecosystem
- Kubernetes and Docker
- AWS, Azure, GCP
- CI/CD pipelines
- SDKs for multiple languages
- Alerting and collaboration tools
Support & Community
Documentation, professional support, tutorials, and developer community available.
#7 — AppDynamics
Short description: AppDynamics provides full-stack observability and APM capabilities to monitor application performance and infrastructure in real time.
Key Features
- Application performance monitoring
- Infrastructure monitoring
- Business transaction monitoring
- End-to-end distributed tracing
- Anomaly detection
- Dashboard visualization
- Alerting and reporting
Pros
- Enterprise-grade full-stack observability
- Strong business context integration
- AI-driven insights
Cons
- Pricing can be high
- Complex setup for large-scale deployments
- Some features require advanced configuration
Platforms / Deployment
Web / Linux / Windows / macOS
Cloud / Self-hosted / Hybrid
Security & Compliance
Supports enterprise security controls, SSO, RBAC, audit logging, and compliance standards like SOC 2.
Integrations & Ecosystem
- Cloud providers
- Kubernetes, Docker
- CI/CD pipelines
- ITSM and incident management tools
- APIs and SDKs
Support & Community
Enterprise support, professional services, extensive documentation, and knowledge base.
#8 — Dynatrace
Short description: Dynatrace is an AI-powered observability platform providing full-stack monitoring, application performance management, and cloud infrastructure insights.
Key Features
- Full-stack monitoring
- Real-time distributed tracing
- AI-based root-cause analysis
- Metrics, logs, and traces correlation
- Cloud and container observability
- Dashboarding and visualization
- Automated anomaly detection
Pros
- Strong AI-driven insights
- Supports hybrid and multi-cloud environments
- Enterprise-grade scalability
Cons
- Cost may be significant for small teams
- Learning curve for full feature utilization
- Deployment configuration can be complex
Platforms / Deployment
Web / Linux / Windows / macOS
Cloud / Hybrid
Security & Compliance
Supports SSO, MFA, RBAC, audit logs. Compliance varies based on deployment.
Integrations & Ecosystem
- AWS, Azure, GCP
- Kubernetes and Docker
- CI/CD pipelines
- Incident management tools
- APIs for custom integrations
Support & Community
Enterprise support, professional services, and documentation available.
#9 — Lightstep
Short description: Lightstep is an observability platform that specializes in distributed tracing and monitoring microservices and large-scale systems.
Key Features
- Distributed tracing
- High-resolution observability
- Correlation of metrics and traces
- Real-time dashboards
- Alerting and incident response
- Integration with CI/CD pipelines
- API-driven instrumentation
Pros
- Excellent for microservices monitoring
- High-resolution tracing for debugging
- Strong scalability for complex systems
Cons
- Requires instrumentation setup
- Enterprise pricing can be high
- Primarily focused on traces, less on metrics visualization
Platforms / Deployment
Web / Cloud
Cloud-managed
Security & Compliance
Supports encryption, RBAC, SSO, and audit logs. Certifications vary by plan.
Integrations & Ecosystem
- Kubernetes, Docker
- CI/CD tools
- Cloud providers
- Incident management tools
- SDKs for multiple languages
Support & Community
Documentation, support plans, and developer community available.
#10 — OpenTelemetry
Short description: OpenTelemetry is an open-source observability framework for generating, collecting, and exporting metrics, logs, and traces across applications and infrastructure.
Key Features
- Unified API and SDK for metrics, logs, traces
- Supports multiple languages and frameworks
- Vendor-agnostic telemetry collection
- Integration with observability backends
- Open-source and community-driven
- Extensible and customizable
- Cloud and on-premise support
Pros
- Open standard for observability
- Vendor-neutral and flexible
- Supports modern cloud-native architectures
Cons
- Requires integration with backend storage and visualization
- Self-hosting requires expertise
- Enterprise support varies
Platforms / Deployment
Linux / Windows / macOS
Cloud / Self-hosted
Security & Compliance
Depends on deployment and backend integration. Security practices depend on hosting environment.
Integrations & Ecosystem
- Prometheus, Grafana
- Jaeger, Tempo
- Cloud providers
- Kubernetes
- CI/CD pipelines
- API-based observability platforms
Support & Community
Active open-source community, documentation, tutorials, and integrations.
Comparison Table
| Tool Name | Best For | Platform(s) Supported | Deployment | Standout Feature | Public Rating |
|---|---|---|---|---|---|
| Datadog | Cloud-native observability | Web / Linux / Windows / macOS | Cloud / Hybrid | Unified logs, metrics, traces | N/A |
| New Relic | Full-stack monitoring | Web / Linux / Windows / macOS | Cloud / Hybrid | Unified observability and AI insights | N/A |
| Splunk Observability Cloud | Enterprise observability | Web / Linux / Windows / macOS | Cloud / Hybrid | Scalable enterprise analytics | N/A |
| Prometheus | Metrics monitoring | Linux / macOS | Self-hosted / Cloud | Open-source metrics collection | N/A |
| Grafana | Data visualization | Web / Linux / Windows / macOS | Cloud / Self-hosted / Hybrid | Dashboards across multiple sources | N/A |
| Honeycomb | Developer-centric observability | Web | Cloud | High-cardinality event analysis | N/A |
| AppDynamics | Enterprise APM | Web / Linux / Windows / macOS | Cloud / Self-hosted / Hybrid | Full-stack monitoring with business context | N/A |
| Dynatrace | AI-powered observability | Web / Linux / Windows / macOS | Cloud / Hybrid | AI-driven root cause analysis | N/A |
| Lightstep | Microservices tracing | Web | Cloud | Distributed tracing at scale | N/A |
| OpenTelemetry | Open-source framework | Linux / Windows / macOS | Cloud / Self-hosted | Vendor-neutral telemetry collection | N/A |
Evaluation & Scoring of Observability Platforms
| Tool Name | Core (25%) | Ease (15%) | Integrations (15%) | Security (10%) | Performance (10%) | Support (10%) | Value (15%) | Weighted Total (0–10) |
|---|---|---|---|---|---|---|---|---|
| Datadog | 9 | 8 | 9 | 8 | 9 | 8 | 7 | 8.45 |
| New Relic | 8 | 8 | 8 | 8 | 8 | 7 | 7 | 7.85 |
| Splunk Observability Cloud | 9 | 7 | 8 | 8 | 9 | 8 | 7 | 8.35 |
| Prometheus | 8 | 7 | 7 | 7 | 8 | 6 | 9 | 7.75 |
| Grafana | 8 | 8 | 8 | 7 | 8 | 7 | 8 | 7.90 |
| Honeycomb | 8 | 7 | 7 | 7 | 8 | 7 | 8 | 7.75 |
| AppDynamics | 9 | 7 | 8 | 8 | 8 | 8 | 7 | 8.20 |
| Dynatrace | 9 | 7 | 8 | 8 | 9 | 8 | 7 | 8.40 |
| Lightstep | 8 | 7 | 7 | 7 | 8 | 7 | 8 | 7.75 |
| OpenTelemetry | 8 | 7 | 8 | 7 | 8 | 6 | 9 | 7.80 |
These scores are comparative and illustrate relative strengths across observability requirements. Higher scores indicate stronger overall capability but may not indicate the ideal fit for every use case.
Which Observability Platform Is Right for You?
Solo / Freelancer
Solo developers need lightweight, easy-to-use tools. Prometheus, Grafana, and OpenTelemetry are strong options for single projects or small cloud-native apps. Honeycomb is useful for debugging high-cardinality events.
SMB
Small and medium businesses should focus on ease of deployment and real-time monitoring. Datadog, New Relic, Grafana, and Honeycomb offer practical dashboards and alerting capabilities.
Mid-Market
Mid-market teams often require distributed tracing, alerting, and cloud-native integration. Datadog, New Relic, Splunk Observability Cloud, Dynatrace, and AppDynamics are strong candidates.
Enterprise
Enterprises need scalability, AI-driven insights, cross-cloud visibility, and compliance support. Datadog, Dynatrace, Splunk, AppDynamics, and Lightstep provide strong enterprise observability capabilities.
Budget vs Premium
Budget-conscious teams may use Prometheus, Grafana, and OpenTelemetry. Premium-focused teams should consider Datadog, Dynatrace, Splunk, and AppDynamics for unified, scalable monitoring.
Feature Depth vs Ease of Use
For ease of use, Datadog, New Relic, and Grafana are practical. For depth and advanced capabilities, Dynatrace, AppDynamics, and Splunk are preferred.
Integrations & Scalability
Integration with cloud providers, Kubernetes, CI/CD, and DevOps tools is crucial. Datadog, Dynatrace, Splunk, AppDynamics, and Lightstep provide strong integration ecosystems.
Security & Compliance Needs
Teams requiring auditability, secure access, and compliance reporting should prioritize Datadog, Dynatrace, Splunk, and AppDynamics.
Frequently Asked Questions
What is an observability platform?
An observability platform collects, analyzes, and visualizes metrics, logs, and traces to provide insights into system performance and health.
Why is observability important?
Observability allows teams to detect, diagnose, and resolve issues quickly, reducing downtime and improving user experience.
Can these tools monitor cloud-native applications?
Yes. Modern observability platforms support cloud-native environments, containers, Kubernetes, and serverless architectures.
How do observability platforms differ from traditional monitoring?
Traditional monitoring relies on static metrics and thresholds, whereas observability platforms provide real-time insights, tracing, and anomaly detection.
Do observability tools require agent installation?
Most require lightweight agents or SDKs for data collection, though cloud-native services may use APIs and integrations.
Are AI-driven insights necessary?
AI-driven insights help identify anomalies and root causes faster but are optional depending on team needs.
Which tool is best for small teams?
Prometheus, Grafana, and OpenTelemetry are lightweight options. Honeycomb is good for event-driven analysis.
Which tool is best for enterprises?
Datadog, Dynatrace, Splunk Observability Cloud, and AppDynamics offer enterprise-scale observability.
Can observability platforms integrate with CI/CD pipelines?
Yes, they often integrate with pipelines to monitor deployments, track changes, and detect regressions.
How often should data be collected?
Data collection is typically continuous, with metrics, logs, and traces gathered in real time for accurate insights.
Are these tools only for DevOps teams?
No. Observability benefits developers, SREs, IT operations, and business stakeholders seeking performance insights.
Conclusion
Observability platforms are essential for maintaining performance, availability, and reliability in modern distributed systems. Datadog, New Relic, Dynatrace, Splunk, and AppDynamics are strong enterprise solutions, while Prometheus, Grafana, and OpenTelemetry are excellent open-source options. Honeycomb and Lightstep offer developer-centric high-resolution insights. The ideal platform depends on environment complexity, team size, integration needs, and budget.