Upgrade & Secure Your Future with DevOps, SRE, DevSecOps, MLOps!
We spend hours scrolling social media and waste money on things we forget, but won’t spend 30 minutes a day earning certifications that can change our lives.
Master in DevOps, SRE, DevSecOps & MLOps by DevOps School!
Learn from Guru Rajesh Kumar and double your salary in just one year.
Introduction
Self-service analytics tools help business users explore data, build reports, create dashboards, and answer questions without depending on data teams for every request. In simple English, these tools allow sales, finance, marketing, product, operations, and leadership teams to work with data more independently while still following governance and security rules.
Self-service analytics matters more now because companies need faster decisions, AI-assisted insights, real-time visibility, and trusted reporting across teams. Waiting days or weeks for every data request slows business growth and creates reporting bottlenecks. Good self-service analytics platforms reduce this dependency by giving users guided, governed, and easy-to-use analytics experiences.
Common use cases include:
- Sales pipeline and revenue analysis
- Customer behavior tracking
- Marketing campaign performance
- Finance and budget reporting
- Product usage analytics
- Executive KPI dashboards
Buyers should evaluate:
- Ease of use
- Data source connectivity
- Dashboard and visualization quality
- AI-assisted analytics
- Governance and permissions
- Data modeling and semantic layer
- Collaboration features
- Mobile access
- Embedded analytics
- Pricing and scalability
Best for: business analysts, revenue teams, finance leaders, operations managers, marketing teams, product teams, data teams, executives, SMBs, mid-market companies, and enterprises that want faster data access with governance.
Not ideal for: teams with very small data needs, organizations without clean data sources, or companies that require only one-time spreadsheet analysis instead of ongoing analytics.
Key Trends in Self-Service Analytics Tools
- AI-assisted data exploration: Users can ask questions in natural language and receive charts, summaries, and suggested insights.
- Governed self-service analytics: Companies want business users to explore data safely without creating conflicting reports or metric definitions.
- Semantic layers are becoming important: Shared definitions for revenue, churn, profit, active users, and customer segments help reduce confusion.
- Real-time analytics is growing: Teams need faster updates for sales, marketing, product, finance, and operational decisions.
- Embedded analytics adoption is increasing: Businesses want analytics inside internal tools, SaaS products, customer portals, and workflow applications.
- Cloud-native analytics is becoming standard: Modern analytics tools are built to work with cloud warehouses, data lakes, SaaS platforms, and API-based systems.
- Collaboration around data is improving: Teams need comments, annotations, shared dashboards, alerts, and business context inside analytics tools.
- Data governance and access controls are now expected: RBAC, row-level security, SSO, audit logs, and permissions are important for safe adoption.
- Automated insights are reducing manual analysis: Tools are adding anomaly detection, smart alerts, trend summaries, and automated recommendations.
- Cost control is a buying priority: Buyers are reviewing user-based pricing, viewer licenses, embedded analytics costs, and data processing charges more carefully.
How We Selected These Tools
The top tools were selected using practical evaluation logic:
- Strong market adoption and recognition in analytics and BI
- Self-service capabilities for business users
- Dashboard, visualization, and reporting depth
- AI-assisted analytics and natural language features
- Data governance, permissions, and security controls
- Integration with common databases, warehouses, SaaS apps, and spreadsheets
- Fit for SMB, mid-market, and enterprise use cases
- Performance and reliability with growing data volume
- Support, documentation, community, and partner ecosystem
- Balance between ease of use, advanced features, and long-term value
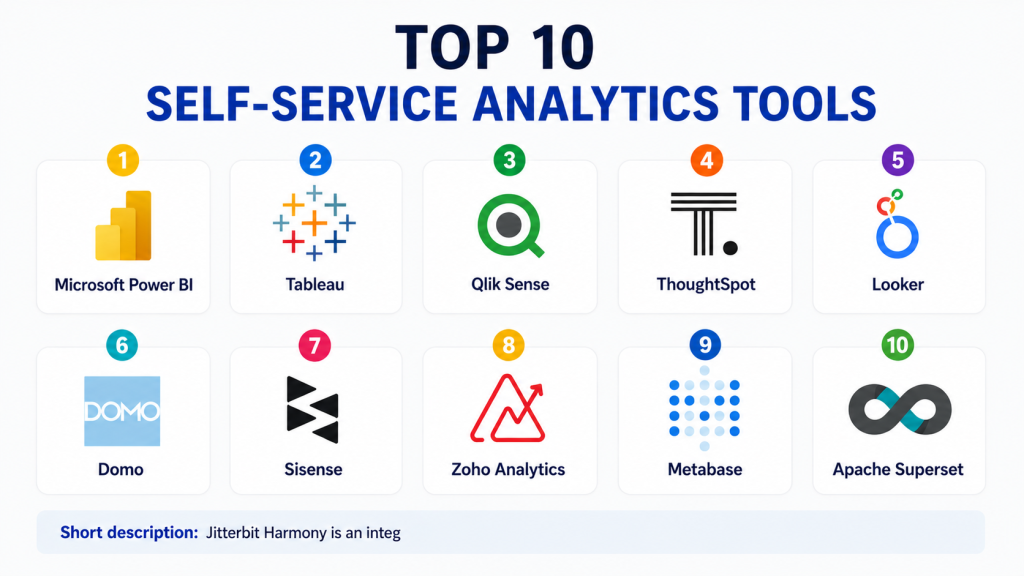
Top 10 Self-Service Analytics Tools
#1 — Microsoft Power BI
Short description:Microsoft Power BI is a widely used self-service analytics and business intelligence platform for dashboards, reports, and data exploration.
It is especially strong for organizations already using Excel, Microsoft 365, Azure, SQL Server, and Microsoft Fabric.
Power BI allows business users to create interactive reports while giving data teams governance and modeling controls.
It supports data visualization, semantic models, AI-assisted insights, sharing, and enterprise reporting.
Finance, sales, operations, and executive teams often use it for daily decision-making.
Its biggest strength is the balance of usability, affordability, and Microsoft ecosystem integration.
However, larger deployments need clear governance standards to avoid report sprawl.
It is best for businesses that want self-service analytics with strong enterprise adoption.
Key Features
- Interactive dashboards and reports
- Strong Excel and Microsoft integration
- Data modeling and semantic layer support
- AI-assisted insights
- Row-level security
- Mobile reporting
- Embedded analytics options
Pros
- Strong value for many organizations
- Familiar experience for Microsoft users
- Large community and learning resources
Cons
- Complex models require skilled development
- Governance can become difficult without standards
- Performance depends on good data model design
Platforms / Deployment
Web / Windows / iOS / Android
Cloud / On-premises gateway / Hybrid
Security & Compliance
Supports Microsoft identity, SSO, MFA, RBAC, row-level security, audit logs, encryption, and governance controls. Specific compliance depends on Microsoft tenant configuration.
Integrations & Ecosystem
Power BI integrates deeply with Microsoft and many third-party data systems.
- Microsoft Excel
- Microsoft Azure
- Microsoft Fabric
- SQL Server
- Cloud data warehouses
- SaaS business applications
Support & Community
Power BI has strong documentation, large community support, training resources, enterprise support, and a broad partner ecosystem.
#2 — Tableau
Short description:Tableau is a leading analytics platform known for visual exploration, dashboard design, and self-service data analysis.
It helps users create interactive visual reports without writing complex code.
Tableau is popular with data analysts, business teams, executives, and organizations that value visual storytelling.
It supports dashboarding, data discovery, governed sharing, embedded analytics, and advanced visual analytics.
Business users can explore trends, compare metrics, and uncover patterns through interactive charts.
Its biggest strength is flexible visual analysis and strong dashboard design.
However, enterprise governance and large deployments require planning.
It is best for organizations that want powerful self-service visual analytics.
Key Features
- Advanced data visualization
- Drag-and-drop analytics
- Interactive dashboards
- Data preparation support through related tools
- Embedded analytics
- Governed sharing
- Mobile analytics
Pros
- Excellent visual analytics experience
- Strong for exploratory analysis
- Good for business storytelling with data
Cons
- Licensing can be expensive for some teams
- Advanced setup may require skilled users
- Governance needs planning at scale
Platforms / Deployment
Web / Windows / macOS / iOS / Android
Cloud / Server / Hybrid
Security & Compliance
Supports permissions, authentication, row-level security, audit capabilities, and encryption. Specific compliance certifications should be verified with the vendor.
Integrations & Ecosystem
Tableau connects with a wide range of enterprise data systems.
- Cloud data warehouses
- Databases
- Spreadsheets
- CRM platforms
- Data preparation tools
- Embedded analytics APIs
Support & Community
Tableau has strong documentation, training content, enterprise support, partner resources, and a large analytics community.
#3 — Qlik Sense
Short description:Qlik Sense is a self-service analytics platform known for its associative analytics engine.
It helps users explore data relationships freely instead of following only fixed dashboard paths.
Qlik Sense is used by business analysts, data teams, operations leaders, and enterprises needing flexible data discovery.
The platform supports dashboards, reports, guided analytics, AI-assisted insights, and embedded analytics.
Its associative model can help users find patterns and hidden connections across datasets.
It is useful when teams need more than static reports and want deeper exploration.
However, new users may need time to understand Qlik’s approach.
It is best for organizations that want flexible, governed, and exploratory self-service analytics.
Key Features
- Associative analytics engine
- Interactive dashboards
- Self-service data exploration
- AI-assisted analytics
- Embedded analytics
- Data integration support
- Governed analytics environment
Pros
- Strong exploratory analytics
- Good for discovering hidden patterns
- Flexible dashboard and reporting capabilities
Cons
- Learning curve for new users
- Advanced use cases require skilled setup
- Pricing may not fit very small teams
Platforms / Deployment
Web / iOS / Android
Cloud / SaaS / Client-managed options vary
Security & Compliance
Supports authentication, role-based access, governance controls, and enterprise security features. Specific certifications should be verified with the vendor.
Integrations & Ecosystem
Qlik connects with many enterprise data and business systems.
- Databases
- Cloud warehouses
- ERP systems
- CRM systems
- Data integration tools
- APIs and embedded analytics
Support & Community
Qlik provides documentation, training, enterprise support, partner services, and an active analytics community.
#4 — ThoughtSpot
Short description:ThoughtSpot is a self-service analytics platform focused on search-based and AI-assisted data exploration.
It allows users to ask business questions in natural language and receive visual answers.
ThoughtSpot is designed for business users who need fast insights without building dashboards manually.
The platform works well with cloud data warehouses and modern analytics environments.
It supports search analytics, AI insights, dashboards, governed access, and embedded analytics.
Its biggest strength is making analytics feel closer to search instead of traditional report building.
However, the experience depends heavily on clean data models and good semantic setup.
It is best for companies that want AI-powered self-service analytics for business teams.
Key Features
- Search-based analytics
- Natural language querying
- AI-assisted insights
- Live analytics on cloud data
- Dashboards and reports
- Embedded analytics
- Governed self-service controls
Pros
- Easy question-based analytics experience
- Strong AI and search capabilities
- Good fit for cloud data platforms
Cons
- Requires well-modeled data
- May not replace all traditional reporting workflows
- Setup quality strongly affects adoption
Platforms / Deployment
Web
Cloud / SaaS
Security & Compliance
Supports enterprise authentication, permissions, access controls, and governed analytics features. Specific certifications should be verified with the vendor.
Integrations & Ecosystem
ThoughtSpot integrates with modern data platforms and business workflows.
- Cloud data warehouses
- Databases
- Data modeling layers
- Embedded analytics APIs
- BI workflows
- Business applications
Support & Community
ThoughtSpot offers documentation, enterprise support, onboarding resources, training, and customer success services.
#5 — Looker
Short description:Looker is a cloud-based analytics platform focused on governed metrics, semantic modeling, and self-service data exploration.
It helps organizations define business logic centrally so users can explore consistent and trusted data.
Looker is often used by cloud-first companies with modern data warehouses.
The platform supports dashboards, reports, embedded analytics, data applications, and governed self-service analytics.
It is strong when teams need shared definitions for metrics like revenue, margin, churn, and active users.
Its modeling layer helps reduce conflicting reports across departments.
However, setup requires technical knowledge and strong data modeling practices.
It is best for organizations that want governed self-service analytics with a semantic layer.
Key Features
- Semantic modeling layer
- Governed business metrics
- Cloud-based analytics
- Dashboards and reports
- Embedded analytics
- Data exploration interface
- API and data application support
Pros
- Strong metric consistency
- Good for cloud data warehouse environments
- Useful for embedded and governed analytics
Cons
- Requires technical modeling skills
- Less simple for casual users at first
- Best value depends on strong data warehouse design
Platforms / Deployment
Web
Cloud / SaaS
Security & Compliance
Supports enterprise permissions, authentication, access controls, and governed analytics. Specific certifications should be verified with the vendor.
Integrations & Ecosystem
Looker works well with modern cloud analytics environments.
- Google Cloud ecosystem
- Cloud data warehouses
- Databases
- Embedded analytics APIs
- Data applications
- Business intelligence workflows
Support & Community
Looker provides documentation, support resources, training, and cloud analytics ecosystem support.
#6 — Domo
Short description:Domo is a cloud-based self-service BI and analytics platform designed for business users, executives, and operational teams.
It helps organizations connect data sources, build dashboards, monitor KPIs, and automate business workflows.
Domo is useful when companies want many departments to access data in one business-friendly platform.
It supports dashboards, alerts, data integration, mobile analytics, collaboration, and app-building features.
Sales, marketing, finance, and operations teams often use it for performance monitoring.
Its biggest strength is broad connectivity and easy business visibility.
However, pricing and governance should be reviewed carefully for large deployments.
It is best for organizations that want cloud-based analytics with strong business usability.
Key Features
- Cloud dashboards
- Data connectors
- KPI monitoring
- Alerts and notifications
- Collaboration features
- Mobile analytics
- App-building capabilities
Pros
- Business-friendly interface
- Good for executive and operational reporting
- Broad connector ecosystem
Cons
- Pricing may be high for some teams
- Complex governance needs planning
- Advanced modeling may require skilled users
Platforms / Deployment
Web / iOS / Android
Cloud / SaaS
Security & Compliance
Supports authentication, access controls, governance features, and audit capabilities. Specific compliance certifications should be verified with the vendor.
Integrations & Ecosystem
Domo connects with many business applications and data systems.
- CRM systems
- Marketing platforms
- Finance tools
- Databases
- Cloud storage
- APIs and connectors
Support & Community
Domo provides documentation, onboarding resources, enterprise support, training, and customer success services.
#7 — Sisense
Short description:Sisense is an analytics platform focused on dashboards, embedded analytics, and customizable data experiences.
It is often used by SaaS companies, product teams, and enterprises that need analytics inside applications.
Sisense helps teams create reports, visualizations, data products, and customer-facing analytics experiences.
It supports APIs, embedding, data modeling, dashboard creation, and scalable analytics delivery.
The platform is useful when analytics must be part of a product or workflow rather than a separate BI portal.
Its biggest strength is embedded and developer-friendly analytics.
However, deeper customization may require technical resources.
It is best for product-led companies and teams building analytics into apps or portals.
Key Features
- Embedded analytics
- Interactive dashboards
- API-based customization
- White-label analytics
- Data modeling
- Scalable analytics delivery
- Developer-friendly tooling
Pros
- Strong embedded analytics capabilities
- Good for SaaS and product teams
- Flexible customization options
Cons
- May require developer support
- Not always ideal for basic reporting needs
- Pricing depends heavily on use case
Platforms / Deployment
Web
Cloud / Hybrid options vary
Security & Compliance
Supports authentication, permissions, access controls, and secure embedding options. Specific certifications should be verified with the vendor.
Integrations & Ecosystem
Sisense integrates with databases, applications, and product environments.
- Databases
- Cloud warehouses
- SaaS systems
- APIs
- Web applications
- Customer portals
Support & Community
Sisense provides documentation, developer resources, onboarding help, enterprise support, and implementation services.
#8 — Zoho Analytics
Short description:Zoho Analytics is a self-service BI and reporting platform designed for SMBs and business teams.
It helps users create dashboards, reports, charts, and business insights from different data sources.
Zoho Analytics is especially useful for organizations already using Zoho CRM, Zoho Books, or other Zoho applications.
It supports data blending, visual analysis, scheduled reports, AI-assisted insights, and business app connectors.
Sales, marketing, finance, and support teams can use it to track performance without deep technical skills.
Its biggest strength is affordability and ease of use for smaller teams.
However, it may not match the deepest enterprise analytics capabilities of larger platforms.
It is best for SMBs that want practical self-service analytics with low complexity.
Key Features
- Dashboard and report builder
- Zoho app integrations
- Data blending
- AI-assisted insights
- Scheduled reports
- Drag-and-drop visualization
- Business app connectors
Pros
- Good value for SMBs
- Easy for business users
- Strong fit for Zoho ecosystem
Cons
- Less advanced than some enterprise BI tools
- Best value comes with Zoho adoption
- Complex governance may need additional tools
Platforms / Deployment
Web / iOS / Android
Cloud / SaaS
Security & Compliance
Supports user permissions, authentication controls, and data security features. Specific compliance certifications should be verified with the vendor.
Integrations & Ecosystem
Zoho Analytics connects with Zoho apps and many business systems.
- Zoho CRM
- Zoho Books
- Spreadsheets
- Databases
- Cloud storage
- Business applications
Support & Community
Zoho provides documentation, help resources, onboarding guidance, and support through its broader business software ecosystem.
#9 — Metabase
Short description:Metabase is a simple and open-source-friendly analytics tool for dashboards, questions, and lightweight BI.
It is popular with startups, developers, small businesses, and teams that want quick access to data.
Metabase allows users to connect databases, build charts, create dashboards, and ask questions using a visual interface.
It also supports SQL for technical users who need more control.
The platform is easier to start with than many enterprise analytics tools.
It works well for internal reporting, product metrics, operational dashboards, and basic self-service analytics.
However, advanced enterprise governance and complex analytics may require additional tools.
It is best for teams that want practical analytics without heavy implementation effort.
Key Features
- Simple dashboard creation
- No-code query builder
- SQL editor
- Open-source option
- Database connectivity
- Sharing and permissions
- Basic embedding options
Pros
- Easy to set up and use
- Strong value for small teams
- Good for developer-led analytics
Cons
- Limited advanced enterprise governance
- Visualization depth is simpler than premium tools
- Scaling depends on deployment and data architecture
Platforms / Deployment
Web
Cloud / Self-hosted
Security & Compliance
Supports permissions and authentication options. Specific enterprise security and compliance details vary by edition and deployment.
Integrations & Ecosystem
Metabase connects with many databases and common data platforms.
- PostgreSQL
- MySQL
- BigQuery
- Snowflake
- Redshift
- SQL Server
Support & Community
Metabase has strong documentation, open-source community support, paid support options, and active user resources.
#10 — Apache Superset
Short description:Apache Superset is an open-source analytics and dashboarding platform for technical teams and data-driven organizations.
It helps users explore SQL-based data, build dashboards, create charts, and manage visual analytics.
Superset is often used by engineering-led teams that want flexibility, control, and self-hosted deployment.
It supports many databases, custom visualizations, role-based access, and dashboard sharing.
The platform is useful for organizations that have internal technical resources and want open-source analytics.
It is powerful for teams comfortable with infrastructure and data engineering.
However, it is less simple for non-technical users compared with fully managed BI platforms.
It is best for technical teams that want open-source self-service analytics with control.
Key Features
- Open-source analytics platform
- SQL-based exploration
- Dashboard and chart creation
- Role-based access control
- Database connectivity
- Custom visualization support
- Self-hosted flexibility
Pros
- Open-source and flexible
- Good for technical teams
- Strong database connectivity
Cons
- Requires engineering setup and maintenance
- Less polished for casual business users
- Support depends on community or service providers
Platforms / Deployment
Web
Self-hosted / Cloud infrastructure depending on deployment
Security & Compliance
Supports role-based access controls and authentication configuration. Compliance depends on deployment, infrastructure, and internal configuration.
Integrations & Ecosystem
Superset integrates with many SQL-based systems.
- PostgreSQL
- MySQL
- Snowflake
- BigQuery
- Redshift
- Trino and Presto
Support & Community
Apache Superset has open-source community support, documentation, and third-party service providers. Enterprise support depends on selected vendors or internal teams.
Comparison Table
| Tool Name | Best For | Platform(s) Supported | Deployment | Standout Feature | Public Rating |
|---|---|---|---|---|---|
| Microsoft Power BI | Microsoft-based self-service BI | Web / Windows / iOS / Android | Cloud / Hybrid | Strong Microsoft integration | N/A |
| Tableau | Visual self-service analytics | Web / Windows / macOS / iOS / Android | Cloud / Server / Hybrid | Advanced visual exploration | N/A |
| Qlik Sense | Exploratory analytics | Web / iOS / Android | Cloud / SaaS / Client-managed | Associative analytics engine | N/A |
| ThoughtSpot | AI-powered search analytics | Web | Cloud / SaaS | Natural language analytics | N/A |
| Looker | Governed cloud analytics | Web | Cloud / SaaS | Semantic modeling layer | N/A |
| Domo | Business-user cloud analytics | Web / iOS / Android | Cloud / SaaS | Broad business connectivity | N/A |
| Sisense | Embedded self-service analytics | Web | Cloud / Hybrid | Product-facing analytics | N/A |
| Zoho Analytics | SMB self-service reporting | Web / iOS / Android | Cloud / SaaS | Affordable business analytics | N/A |
| Metabase | Lightweight internal analytics | Web | Cloud / Self-hosted | Simple open-source-friendly BI | N/A |
| Apache Superset | Technical open-source analytics | Web | Self-hosted / Cloud infrastructure | Flexible open-source dashboards | N/A |
Evaluation & Scoring of Self-Service Analytics Tools
| Tool Name | Core (25%) | Ease (15%) | Integrations (15%) | Security (10%) | Performance (10%) | Support (10%) | Value (15%) | Weighted Total |
|---|---|---|---|---|---|---|---|---|
| Microsoft Power BI | 9 | 8 | 9 | 9 | 8 | 9 | 9 | 8.70 |
| Tableau | 9 | 8 | 9 | 8 | 8 | 9 | 7 | 8.35 |
| Qlik Sense | 9 | 7 | 8 | 8 | 8 | 8 | 7 | 7.95 |
| ThoughtSpot | 8 | 9 | 8 | 8 | 8 | 8 | 7 | 8.05 |
| Looker | 8 | 7 | 9 | 8 | 8 | 8 | 7 | 7.90 |
| Domo | 8 | 8 | 8 | 8 | 8 | 8 | 7 | 7.90 |
| Sisense | 8 | 7 | 8 | 8 | 8 | 8 | 7 | 7.75 |
| Zoho Analytics | 7 | 8 | 7 | 7 | 7 | 7 | 9 | 7.45 |
| Metabase | 7 | 9 | 7 | 7 | 7 | 7 | 9 | 7.60 |
| Apache Superset | 7 | 6 | 8 | 7 | 7 | 6 | 9 | 7.10 |
These scores are comparative and should be used as a starting point, not as a final buying decision. A tool with a lower score may still be the best fit if it matches your budget, stack, and team skills. Always test real data sources, user workflows, security needs, and dashboard performance before selecting a platform.
Which Self-Service Analytics Tool Is Right for You?
Solo / Freelancer
Solo users usually need simple dashboards, affordable pricing, and quick setup. Zoho Analytics, Metabase, and Power BI are practical choices. If you already use Excel or Microsoft tools, Power BI is a strong fit. If you prefer open-source-friendly analytics, Metabase is easier to start with than many enterprise platforms.
SMB
SMBs should prioritize ease of use, fast onboarding, and low maintenance. Zoho Analytics, Power BI, Metabase, and Domo can be useful depending on budget and data sources. For SMBs using Zoho apps, Zoho Analytics can be especially convenient.
Mid-Market
Mid-market companies usually need stronger governance, better integrations, and shared dashboards across departments. Power BI, Tableau, Qlik Sense, ThoughtSpot, Looker, and Domo are strong options. The best choice depends on whether the company values visual analysis, governed metrics, AI-assisted search, or broad business connectivity.
Enterprise
Enterprises should focus on governance, scalability, user permissions, auditability, semantic modeling, and performance. Power BI, Tableau, Qlik Sense, ThoughtSpot, Looker, and Sisense are strong enterprise candidates. Enterprises should also test security and data access rules before rollout.
Budget vs Premium
Budget-conscious teams may prefer Metabase, Apache Superset, Zoho Analytics, or Power BI. Premium platforms such as Tableau, ThoughtSpot, Looker, Sisense, and Qlik Sense may be worth it when deeper analytics, stronger governance, embedded analytics, or AI-assisted exploration are important.
Feature Depth vs Ease of Use
Power BI offers a strong balance of depth and usability. Tableau is strong for visual analytics. ThoughtSpot is easier for natural language exploration. Looker is better for governed metrics but needs technical modeling. Metabase and Zoho Analytics are simpler for smaller teams.
Integrations & Scalability
If your stack is Microsoft-heavy, Power BI is a strong option. If you need cloud warehouse analytics with governed metrics, Looker is worth evaluating. If you need embedded analytics, Sisense is strong. If you want open-source flexibility, Apache Superset may fit technical teams.
Security & Compliance Needs
Security-focused teams should validate SSO, MFA, RBAC, row-level security, audit logs, encryption, data residency, and admin controls. Self-service analytics should never mean uncontrolled data access. The right platform should help users explore data while protecting sensitive information.
Frequently Asked Questions
1. What are self-service analytics tools?
Self-service analytics tools allow business users to explore data, create dashboards, and answer questions without depending on data teams for every report. They make analytics faster and more accessible across departments.
2. How are self-service analytics tools different from traditional BI?
Traditional BI often depends more on IT or data teams to build reports. Self-service analytics gives business users more control while still using governance, permissions, and trusted data models.
3. Why are self-service analytics tools important?
They reduce reporting delays, improve decision-making, and help teams act faster. When used properly, they also free data teams to focus on complex modeling, governance, and advanced analytics.
4. Are self-service analytics tools safe for business users?
Yes, if they include proper governance features such as role-based access, row-level security, audit logs, and approved datasets. Without governance, self-service analytics can create data confusion and security risks.
5. Which tool is best for beginners?
Zoho Analytics, Metabase, and Power BI are good starting points for beginners. They offer easier dashboard creation and lower entry barriers compared with some complex enterprise analytics platforms.
6. Which tool is best for large enterprises?
Power BI, Tableau, Qlik Sense, Looker, ThoughtSpot, and Sisense are strong enterprise options. The best choice depends on existing systems, governance needs, security controls, and analytics maturity.
7. How much do self-service analytics tools cost?
Costs vary based on users, viewer licenses, data volume, deployment type, premium features, support, and embedded analytics needs. Many enterprise plans require custom pricing.
8. What are common implementation mistakes?
Common mistakes include connecting poor-quality data, giving users too much access, skipping metric definitions, creating too many dashboards, and not training users. Good governance and onboarding are essential.
9. Can self-service analytics tools connect to CRM and ERP systems?
Yes, many tools connect with CRM, ERP, databases, cloud warehouses, spreadsheets, and SaaS platforms. Connector quality varies, so teams should test integrations before making a final decision.
10. Do self-service analytics tools support AI?
Many modern tools include AI features such as natural language queries, smart insights, anomaly detection, automated summaries, and recommendations. The depth and reliability of these features differ by platform.
Conclusion
Self-service analytics tools help organizations move from slow, centralized reporting to faster, more flexible, and more data-driven decision-making. The best platform depends on your business size, data stack, governance needs, user skills, and budget. Power BI is strong for Microsoft-based teams, Tableau is excellent for visual exploration, ThoughtSpot is useful for AI-powered search analytics, Looker is strong for governed cloud analytics, and Metabase or Apache Superset can work well for technical or budget-conscious teams. No single tool is best for every company.